
A NOVEL LIQUID SETTLEMENT SYSTEM FOR SAG MEASUREMENT OFFERS A WESTERN UNDERGROUND MINE THE OPPORTUNITY TO EXAMINE DIFFERENCES IN ROOF SAG BETWEEN CONVENTIONAL PLACE-CHANGE AND MINER-BOLTER USE
By Andy Shaffer and James Pile
Until recently, real-time roof sag measurements at the time of mining were not possible in coal mines due to equipment permissibility restrictions. Intrinsically safe miniature data acquisition systems (MIDAS) data loggers with the capability to store the large density of data generated are a new development.
The combination of MIDAS data loggers with overflow settlement measurement practices adapted from dam and embankment monitoring by RST Instruments Ltd. (known as a liquid settlement system or LSS) were used indirectly to measure roof sag by measuring fluid pressure in water-filled tubes at four horizons in the immediate roof. Changes in pressure are recorded by the transducers and, during post-processing, the measured pressures are converted to changes in height or roof sag.
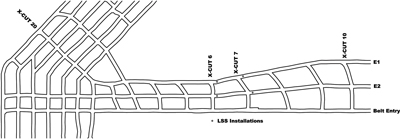 |
| Figure 1: Location map. |
The LSS was devised to be installed in the roof ahead of mining and measure roof sag ahead of and at the face in real-time while mining. The system was installed at a western U.S. longwall mine as part of a geotechnical study comparing differences in roof response between standard place-change mining and mining with a miner-bolter. The LSS was intended to measure any ground control advantage that a miner-bolter might offer with earlier installation of roof bolts. The LSS, coupled with the MIDAS data loggers, were installed by Agapito Associates in early October 2013 at cross-cut (XC) 6 in entries 1 and 2 and approximately one month later at XC 7 in entries 1 and 2 in a development gateroad (Figure 1).
LSS SYSTEM COMPONENTS
The LSS system is comprised of three main components (see Figure 2):
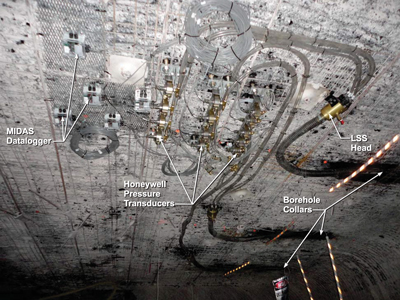 |
| Figure 2: Entry 2, XC 6 transducer and MIDAS LSS installation in roof. |
• A 2.9-in. outside diameter overflow tube assembly that is approximately 31.6 ft long that houses four smaller tubes that vary in length from 16 to 31 ft for measurements at differing horizons as well as a large aluminum “head” assembly for securing to the roof.
• Honeywell Model TJE 0 to 5-psi pressure transducers.
• MIDAS M4GP16A data loggers with M4IAGPA instrument amplifiers. Data loggers were read wirelessly using the accompanying M4UIA user interface.
INSTALLATION
The installation of the LSS required drilling three equally spaced NQ (2.985-in.) gauge holes in the roofs of Entries 1 and 2 (at XC 6 and 7) at an angle of approximately 4˚ up from the local coal seam dip (Figure 3). The LSS tube assembly was inserted into the boreholes immediately after drilling. The four 3/8-in. tubes were then carefully routed and secured to the roof mesh (Figure 4) and connected to the TJE pressure transducers on the outby end. The opposite (inby) end of the 3/8-in. tubing was connected to a centering spacer via a hose barb fitting and open to the atmosphere in the overflow tube at four varying heights in the overflow tube.
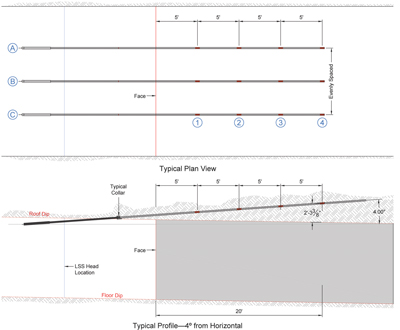 |
| Figure 3: LSS installation layout.. |
Each tube was filled with water via a quick disconnect fitting from the transducer until return was observed coming back from the end of the tube at the LSS head. Care was taken to not over-pressurize the transducers while filling took place.
Pressure transducers for the LSS system were anchored near each LSS head with 18-in. epoxied threaded bar and the LSS heads were mounted with 12-in. epoxied threaded bar. MIDAS data loggers were mounted to expanded metal and attached to the roof mesh near each corresponding transducer.
| Figure 4: Securing LSS Tubing to Roof Mesh at XC 6 Entry 1. |
For the comparison of roof sag in each entry, all conventional place-change mining operations took place in Entry 1 and the miner-bolter operated out of Entry 2 in XC 6 and XC 7. Local geology around the XC 6 and XC 7 installation locations had a sandstone roof, which differs from the typical mudstone roof at the mine. The sandstone roof is likely stiffer than the typical mudstone roof, resulting in smaller magnitudes of roof sag.
DATA PROCESSING
By design, each instrumented entry was equipped with a stationary “reference” transducer open to the mine atmosphere. The reference transducer was intended to capture the localized pressure changes in each entry and, later, correct LSS gage data by either adding or subtracting the collected reference data.
Raw data during each respective cut in entries 1 and 2 at XC 6 and XC 7 were collected every 10 seconds for approximately the first day, after which the frequency was reduced to once every hour.
Figure 5 shows the raw data for the middle (B) LSS XC 6 Entry 2 (top). The data show the change in height (inches) experienced by each cell starting at the beginning of the mining cycle (November 1 to November 26, 2013). The reference transducer data (in cyan) and change in temperature (in heavy black) are also plotted.
Atmospheric temperature and barometric pressure fluctuations have a strong observable effect on the gage responses. These phenomena can be seen in Figure 5, where large changes in temperature (in heavy black) influence the data at similar time points. Pressure effects seem to play a smaller role in most entries where the local atmosphere is generally stable, except for the data in XC 7 Entry 1, which shows large pressure regimes thought to be a byproduct of section ventilation fans (not shown). Therefore, the correction applied to the raw LSS data is twofold, a temperature-based correction and a pressure-based correction.
The current derived empirical temperature correction is based upon control data from an LSS system test experiment conducted at Agapito’s Grand Junction, Colorado, laboratory. The correction is based on a factor of -0.03 in./degrees Celsius using the linear best fit of three LSS cell height and temperature data. This factor is applied to the delta temperature at each data point of the current LSS data as either an added or subtracted correction from the change in height measured. Following the temperature correction, the reference transducer (pressure) corrections are applied. This is justified because the reference data appears to be isolated from the temperature effects observed in the raw LSS data.
The temperature and reference corrected data for middle (B) LSS XC6 Entry 2 are shown in Figure 5 (bottom). No smoothing algorithms have been applied to these data.
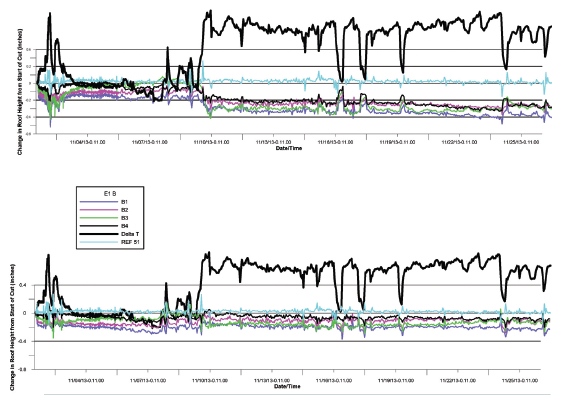 |
| Figure 5: XC Entry 2 Middle LSS (8) raw and processed data. |
INTERPRETATION OF DATA
The corrections made to the data to date have been in response to the pressure and temperature trends discussed above since the instrumented cuts were taken. While these two corrections do seem to account for the majority of the pressure and temperature fluctuations, there may be other influences that have a bearing on the overall LSS system. Since this assemblage of instruments and data loggers is new to the application of roof sag monitoring, relevant case studies for comparison are not available.
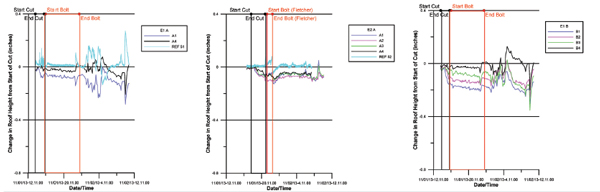 |
| Figure 6a: XC 6 Entries 1 and 2, first 24 hours of processed LSS data. |
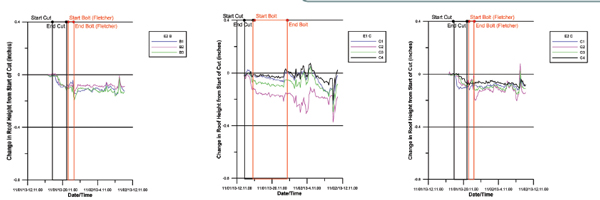 |
| Figure 6b: XC 6 Entries 1 and 2, first 24 hours of processed LSS data. |
Figures 6 and 7 are plots showing temperature- and pressure-corrected data from the first 24 hours following the start of each cut with notes showing approximate mining cycle times. The initial response measured in the first 24 hours during the mining and bolting cycles shows the type of behavior that is expected of the roof. Exceptions to this are at XC 7 Entry 1 (as discussed) and Entry 2 (where the “A” borehole was exposed in several locations during mining and at the “B” borehole where the miner-bolter hit the outer LSS overflow tube).
Measurements from the first 24 hours are considered the most meaningful data. Later measurements show increased influence from atmospheric changes leading to instrument drift that, thus far, cannot be reliably corrected.
No strong distinction is clearly evident between the overall amount of roof sag in the place-change entry (E1) versus the miner-bolter entry (E2). This is largely because of uncorrectable “noise” in the LSS system, which obscures the pure roof sag response.
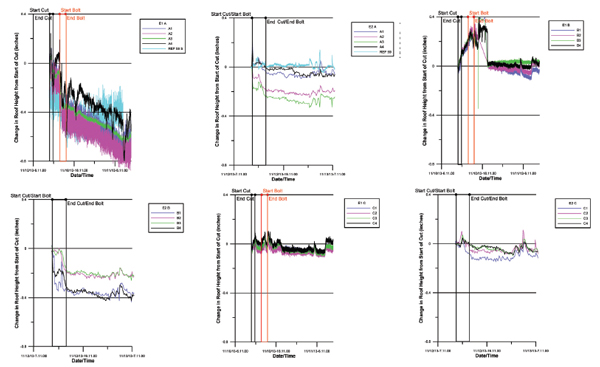 |
| Figure 7: XC 7 Entries 1 and 2, first 24 hours of processed LLC data. |
Neither AAI nor the instrument manufacturer (RST) has been able to correct for atmospheric variables to a degree sufficient to isolate the pure roof sag response. While the LSS system appears to be functioning properly, preliminary indications are that the magnitude of roof sag with the immediate sandstone roof in either entry is so small as to be near the limit of precision possible with the LSS system as compared to a less stiff mudstone roof. This alone might suggest that the roof sees little difference between the two types of mining equipment tested considering the actual level of precision relationships between temperature, pressure and gage response, and provide a more certain basis for atmospheric correction.
CONCLUSIONS
Roof sag data were collected every 10 seconds during the cut-and-bolt sequences in each of four instrumented entries during the first 24 hours of mining. The LSS provided relatively stable roof sag measurements with relatively little drift and the MIDAS data logger reliably collected a high density of data. Results indicate that while the system is capable of providing sag measurements to within fractions of an inch, improved precision will be necessary for effectively distinguishing roof behavior between place-change and on-board miner-bolter cut sequencing in environments with very small amounts of roof sag. Moreover, the MIDAS data logger combined with the LSS is innovative permissible technology that shows promise for stable, real-time measurements of roof sag and other ground responses in coal mines using commercially available, relatively low cost hardware.
Areas for future investigation include:
• Use of transducers with a smaller pressure range (e.g., 0-2.5 psi) to allow for greater overall resolution in measurement, depending on the expected amount of total sag to be measured.
• Further refinement of established temperature and pressure corrections, and identification of other environmental corrections to further isolate actual roof sag data from LSS data.
• Use of a medium other than water in the LSS tubes to increase longevity (by reducing or eliminating evaporation) and sensitivity (by using a heavier liquid). Additionally, a smaller diameter tube could also be used to minimize the effects of evaporation.
Other exciting potential applications of LSS and MIDAS data logger system include:
• Installation above and inside coal mine yield pillars to measure convergence inside the pillar during yielding. Armored tubes likely would be required in the pillar.
• Installation during backfill emplacement to measure backfill settlement and convergence.
Andy Shaffer is a project engineer for Agapito Associates in Grand Junction, Colorado. James Pile is a senior mining engineer for BHP Billiton in Waterflow, New Mexico. This research was presented at the 33rd International Conference on Ground Control in Mining in Morgantown, West Virginia, in August 2014. The 34th ICGCM has been set for July 28-30, 2015.