

Monthly average ISO day-ahead market peak hours prices for December 2014 decreased in the eastern U.S. compared to the previous year. The ISO New England Inc., NEPOOL-Mass hub saw the largest decrease over that time with the price dropping nearly 55% to $50.55/MWh. The New York ISO Zone J also experienced a large drop, falling 41% to $42.91 MWh. NEPOOL-Mass and Zone J hubs encompass the Boston and New York City metropolitan areas, respectively, which were most affected by pressure on power and gas supplies and transportation systems due to the strong demand that the weather created last winter.
The Midcontinent Independent System Operator Inc. Indiana Hub and PJM Interconnection LLC Western Hub saw monthly average day-ahead prices decrease 12% and 20%, respectively. As moderate weather followed the polar vortex, the month of July — one of the most prevalent months for cooling demand in the U.S. — saw decreases in monthly average price at all locations analyzed. Indiana Hub monthly average price fell 7% in July 2014 compared to the previous year to $37.99/MWh, Western hub fell 27% to $45.88/MWh, NEPOOL-Mass fell 28% to $47.03/MWh, while New York Zone J saw the largest decrease year over year in July, down almost 35% to $50.09/MWh.
In the western half of the country, monthly average day-ahead prices also decreased year-over-year in December 2014. Mid-Columbia next-day peak spot prices saw the largest decrease over that time, with the price dropping nearly 46% to $31.03/MWh. Palo Verde, also outside of an ISO/RTO, saw monthly average price decline the second-largest amount, falling nearly 31% to $31.32/MWh. At California ISO NP-15 and Electric Reliability Council of Texas Inc. North hub monthly average ISO day-ahead prices also decreased almost 23% and 21%, respectively.
Similar to the trend in the eastern U.S., July 2014 also showed year-over-year decreases in the monthly average spot price for Palo Verde, which decreased 6% to $46.60, and Mid-Columbia, which decreased almost 20% to $39.24/MWh. However, NP-15 and ERCOT North monthly average day-ahead prices increased year-over-year in July, increasing by 9% to $52.53/MWh and by 7% to $41.42/MWh, respectively.
GAS MARKETS WEAKEN FOLLOWING WINTER SPIKE
Gas prices in the eastern U.S. during 2014 mimicked power prices over the year, showing a large spike last winter, followed by a gradual slide during a mild summer and fall. The early-year severe cold created increased natural gas demand for heating and for electric generation. As gas demand increased for both heating and electric generation, congestion on major pipelines into large demand centers helped lead to price spikes. The National Oceanic and Atmospheric Administration reported that the 2013-2014 winter was one of the coldest on record, with seven Midwest states registering top 10 coldest winters and 17 other states across the country reporting winters that were colder than average.
All seven gas locations analyzed experienced a five-year monthly average high in 2014. Five out of seven locations experienced this high in February 2014, with Algonquin City Gates and Transco Z6 NY experiencing five-year highs in January 2014.
All eastern locations’ monthly average day-ahead price increased in February 2014 compared to the previous year. Chicago price increased 243% year-over-year to $11.94/ MMBtu, Transco Z6 NY increased nearly 34% to $12.46/MMBtu and Algon Gates increased 23% to $21.14/MMBtu. Once the cold subsided, the natural gas prices fell on lower demand and production ramped up to replace depleted reserves. Algon Gates and Transco Z6 NY saw monthly average prices decrease by nearly 31% and 29%, respectively, in July 2014 compared to the year-ago period. Over the same time, prices at the Chicago hub saw nearly an 11% increase to $4.11/MMBtu.
All western locations’ monthly average day-ahead prices also increased in February 2014 compared to the previous year. PG&E Gate price increased 97% year-over-year to $7.20/MMBtu, SoCal Border increased nearly 96% to $6.98/MMBtu, Houston Ship Channel increased 88% to $6.16/MMBtu and the Henry Hub price increased nearly 81% to $6.01/MMBtu.
 All locations west of the Mississippi saw monthly average prices increase slightly in July 2014 compared to the previous year. PG&E Gate price increased nearly 23% year-over-year to $4.70/MMBtu, SoCal Border increased nearly 14% to $4.35/MMBtu, Houston Ship Channel increased 12% to $4.03/MMBtu, and the Henry Hub also increased 12% to $4.08/MMBtu.
A YEAR OF CHALLENGES FOR COAL
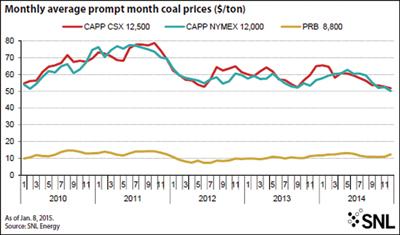
The coal industry experienced many challenges in 2014, declining prompt month coal prices among them. Rail transportation service issues helped impede utilities from rebuilding coal stockpiles, further hurting the demand for coal and contributing to soft prices. Central Appalachia NYMEX December 2014 average prompt month coal declined 13% to $50.06/ton from an average price of $56.60/ton in December 2013. Central Appalachia CSX December 2014 average prompt month coal also declined more than 25% to $51.74 from $64.89 in December 2013.
Declining prices year-over-year has been a common theme for the two CAPP locations since highs were reached in 2011. The CAPP NYMEX monthly average price has dropped nearly 35% since the high in July 2011 of $77.48/ton. The CAPP CSX spec monthly average price also fell 34% from its high price in October 2011 of $78.66/ton. Powder River Basin Wyoming Rail coal was the lone coal product in this analysis to see prices appreciate year-over-year. The December 2014 monthly average price rose nearly 6% to $12.43/ton from $11.81/ton in December 2013. Although the price increased over the past year, the monthly average price, similarly to CAPP prices, dropped 12% from the $14.75/ton high experienced in August 2010.
The downward trend in average prompt month coal prices is projected to continue into 2015, according to a recent BB&T Capital Markets report, due to a number of factors including falling gas prices and the U.S. dollar gaining strength compared to the Euro and Australian dollar.