

| Figure 1: Railroad revenue adequacy of seven Class I railroads. (Red = revenue inadequate) |
Coal-fired utilities and coal producers are both interested in the computation of railroad revenue adequacy because the results feed into the maximum rates that railroads can charge. Producers are interested because those rates may determine whether coal prices are competitive; utilities are interested because those rates may determine whether or not they can make money from the sale of electric energy.
The calculation of an adequate return on investment (ROI) for railroads has been a matter of dispute since well before the Staggers Rail Act of 1980. Even though the Staggers Act deregulated most rail traffic, some shippers (notably coal-burning utilities) believed railroads’ new freedom to raise rates was too much of a good thing. Their fears were partially substantiated when some of the western railroads found it necessary to negotiate their rates back downward from elevated rates they had imposed after the Staggers Act was passed. Rail infrastructure improvements that followed Staggers were essential to opening the Powder River Basin to plants needing cleaner coal, but shipper suspicion of railroad over-charging stayed alive.
On December 31, 2013, the Surface Transportation Board (STB) released its annual findings with respect to the railroad revenue adequacy of seven Class I railroads, Docket No. EP 552 (Sub-No. 17). On October 17, 2013, it had initially found that only two of the seven railroads were revenue adequate in 2012: Union Pacific and Norfolk Southern; however, BNSF had not yet refiled to reflect its adjusted revenue after the Berkshire purchase. After BNSF refiled its R-1 reports for 2010-2012 in compliance with Western Coal Traffic League’s (WCTL) Petition for Declaratory Order (FD35506), BNSF was also found to be revenue adequate. The STB’s average cost of capital to the freight rail industry was 11.12%. The individual 2012 ROIs can be as seen in Figure 1.
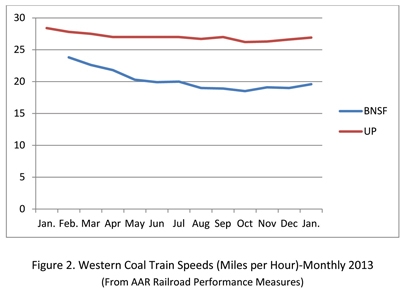 |
| Figure 2: Western coal train speeds (miles per hour)-monthly 2013. (From AAR Railroad Performance Measures) |
Using a traditional approach, the Government Accounting Office (GAO) estimated in 1984 that the railroad cost of capital was 11.84%, remarkably close to the 11.12% number recently computed by STB in 2012. Although most railroads’ ROI under depreciation accounting was higher than under RRB (Retirement-Replacement-Betterment) accounting, none of the Class I railroads the GAO evaluated had reached the traditional cost of capital level in 1984. Burlington Northern Santa Fe was the closest to revenue adequacy under that approach with a return of 9.6%. Basically, the GAO said they were all under-capitalized and had to raise their rates to maintain financial health.
Multistage DCF Model
The discounted cash flow (DCF) valuation approach is based on the theory that the value of a business or project is the sum of its expected future free cash flows, discounted at an appropriate rate. DCF analysis is one of the most fundamental, commonly used valuation methodologies. It is a valuation method developed and supported in academia and is widely used in business. The prevalent form of the DCF model in practice is the single-stage DCF model. Stage 1 is an explicit projection of free cash flows, generally for five to 10 years. Stage 2 is a lump-sum estimate of the cash flows beyond the explicit forecast period. In addition to the two-stage DCF, there are multistage manifestations of the DCF model.
The STB is currently using the multistage DCF model to determine the railroad’s cost of capital; the name alone conjures the impression there are behind-the-scenes mathematicians cranking out undecipherable numbers in support of higher rates. The WCTL prefers that STB use a more realistic formula, which in their mind is represented by the Capital Asset Pricing Model (CAPM). While CAPM generally leads the pack as one of the most widely studied and accepted pricing models, it too is not without its critics. Its assumptions have been criticized from the start as being too unrealistic for investors in the real world.
It is not Coal Age’s intent to evaluate either or both methods, only to comment that both models operate with complex mathematics on estimates of revenue streams and discount rates. The board intends to have two proceedings to deal with the cost of capital calculation and the revenue adequacy calculation. It will establish further procedures for public comment, and will address the issues raised by the parties. The parties will continue to duke it out using their own expert witnesses in STB Docket No. EP 664 (Sub-No. 2), decided December 20, 2013. The STB’s position will be supported by AAR; WCTL’s by the Alliance for Rail Competition and the Chlorine Institute.
Positive Train Control
In response to several fatal rail accidents between 2002 and 2008, Congress passed the Rail Safety Improvement Act of 2008, directing the Federal Railroad Admin-istration (FRA) to promulgate new safety regulations. These new regulations govern different areas related to railroad safety, such as hours of service requirements for railroad workers, Positive Train Control implementation, standards for track inspections, certification of locomotive conductors, and safety at highway-rail grade crossings.
 |
| Figure 3: Eastern coal train speeds (miles per hour)-monthly 2013. (From AAR Railroad Performance Measures) |
The train engineer blamed for the worst U.S. train crash in 15 years was sending and receiving text messages seconds before his crowded commuter train skipped a red light and collided head-on with a freight train. The Metrolink commuter train plowed into a Union Pacific freight locomotive on September 12, 2008, in Chatsworth, Calif., killing 25 people and injuring 135 in the worst train accident since 1993. Cellphone records show the engineer received seven and sent five text messages between 3 p.m. and the time of the accident.
Positive Train Control (PTC) describes technology designed to automatically stop or slow a train before certain accidents occur. In particular, PTC is designed to prevent train-to-train collisions, derailments caused by excessive speed, unauthorized incursions by trains onto sections of track where repairs are being made, and movement of a train through a track switch left in the wrong position. It is a massive program that touches almost every aspect of train operations on major lines. AAR estimates that the major freight railroads will spend approximately $8 billion to put it into effect; by the end of 2012 railroads had spent $2.8 billion.
While PTC seems like a great idea, not all railroaders are in favor of total implementation all at once. Jim Young, chairman of UP, has openly opposed it. Before people are too critical of Young and others that feel the technology is not ready, one should take note of the fact that the law will try to force sweeping changes across 37 railroads almost simultaneously. (If it weren’t for Autoland, the automatic landing system that enables airplanes to land safely in fog-bound airports, Air Alaska could simply cross Seattle off their destinations list. Autoland wasn’t just forced on all airlines when someone discovered airport fog, it took decades to perfect.)
The Rail Safety Improvement Act of 2008 (RSIA) requires Class I railroads to install PTC systems on tracks that carry passengers or toxic-by-inhalation (TIH) materials. Based on a January 2012 final Federal Railroad Administration rule, AAR estimates that PTC technology will have to be deployed on approximately 63,000 miles of U.S. freight rail lines. This will involve the installation of PTC capability on thousands of locomotives; a large, new wireless communications network and tens of thousands of track-side devices connected to signals, switches and other wayside devices.
As originally written, the RSIA mandated that PTC be put into service by the end of 2015. Since enactment of the legislation, railroads have devoted enormous human and financial resources to develop a fully functioning PTC system, and progress to date has been substantial. Still, only one of the four major lines suggests it may be able to meet that date. The others say it may take as long as 2022.
Train Speeds in 2013
All six railroads of the major coal-hauling railroads use the same definitions to calculate their performance data, ensuring a high degree of consistency of the measurements. The level of one railroad’s performance relative to another’s may differ sharply because each railroad is unique. Differences between railroads include terrain, physical routes and network design, traffic mix and volume, the extent of passenger operations, and operational practices. External factors, such as weather and port operations, can also cause variations between railroads and over time. In addition, individual differences in the collection and reporting of operational data may affect the absolute level of the measures on each road to some degree.
BNSF and UP haul coal from the Powder River Basin to coal-fired power plants in the Midwest over similar terrain. UP also hauls coal out of mines in the mountains of Utah and Colorado. In 2013, BNSF coal trains averaged 20.2 miles per hour while UP trains averaged 27 miles per hour, which seems like reverse statistics. One would expect slower times for UP because of the mountains. In other words, it takes BNSF about a third more time to deliver the same amount of coal that UP delivers, which inevitably translates to higher rate requirements for BNSF.
CSXT and NS haul coal out of mines or tipples in Central and Northern Appalachia to coal-fired power plants in the east and to major export terminals along the East Coast. In 2013, CSXT coal trains averaged 19.7 miles per hour, while NS coal trains averaged 17.8 miles per hour. The major difference between the two systems is that, at any particular time, a large number of loaded NS coal cars are parked at Lambert’s Point waiting to be dumped, while those on CSXT export routes are unloaded rapidly upon arrival at the terminals.
One must be careful about jumping to conclusions based on the AAR train speed statistics, especially when the results do not seem to make sense. Clearly, caution should be used when interpreting Figure 2. Even though AAR takes great care to make sure the data submitted to them weekly are on an apples-to-apples basis, the great disparity between BNSF and UP train speeds in Figure 2 cries for a careful examination by anyone to whom the data are important.
A professional engineer and coal consultant with transportation experience, Dave Gambrel writes articles for Coal Age and Engineering & Mining Journal (E&MJ) that offer miners advice on transporting commodities to markets. He may be reached at bunkgambrel@earthlink.net.