

Comparative rates to Rotterdam, a major coal destination for deep-draft vessels, are shown in Table 1 for the month of October. Both Panamax and Capesize vessel rates are shown, but Panamax rates are given for only one point in time. Capesize rates are given one week apart, illustrating the dramatic drop in rates that occurred for shipping coal to Rotterdam. In all likelihood, this rate decrease had nothing to do with Rotterdam, but was related to a falling worldwide demand for Panamax and Capesize vessels. In the one-week period reviewed, rates to Rotterdam decreased $1.55 to $1.80 per ton depending on route.
Panamax rates are shown in two forms: daily rates and rates per ton. In some cases the daily rate is known, but the rate per ton is not given. Such is the case for the actual U.S. Gulf to Rotterdam figure, which was given as $15,500 per day plus a “ballast bonus” of $600,000. The ballast bonus serves as a compensation and incentive for the ballast (empty) leg of the trip from the ship’s last port of discharge to the port where the charter would commence, for example, the first place of loading under a voyage charter or the point of delivery under a time charter. Dry bulk carriers seldom operate on round-trip voyages; the norm is multi-leg or triangular service to avoid excessive ballasting (traveling without paying cargo).
Table 2 shows the monthlong progression of rates in two forms: the Baltic Dry Index (BDI) at the top part of the table, and the related movements of time charter rates for each of the four basic ship classifications.
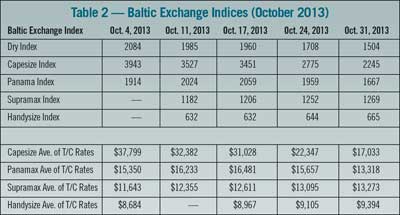
Capesize time charter rates began dropping quickly by mid-October, and by month’s end had dropped to 45% of the beginning rate of $37,800. Daily rates in the Capesize sector rose from $15,000 to more than $40,000 per day, but dropped to $36,500 per day at month’s end. Similar results were noted in the smaller-sized vessels, but for lesser amounts. For example, spot earnings for Panamaxes increased from $8,000 to $14,000 per day. Smaller vessels sometimes commanded higher rates because they were more in demand compared to their supply. Supramax earnings increased from $9,500 to $11,300 per day.
Why did the rates peak during October? Iron ore inventories at 25 major Chinese ports started building much earlier and continued to build. At last check, they sat at 76.5 million tons, a reaction to ore import being delivered to ports, but not distributed further into the steel industry.
During the same period, metallurgical coal demand was also up. Port Waratah Coal Services (PWCS) operates one of the world’s largest coal handling operations in Australia. PWCS shipped 90.5 million tons of coal year-to-date compared to 84.2 million tons for the same period in 2012. China’s share of PWCS October shipments declined to 20% from 28% in September, a harbinger of what was to come in terms of daily and time charter rates. Japan, the largest receiver of PWCS coal, received 53% of the total.
For any given pair of load-destination ports, it is simple to ask “what is the freight rate?” but the answer is seldom simple. With few exceptions, dry bulk vessels do not travel repetitive routes. Handling facilities are not the same; labor agreements and holidays are not the same; availability of suitable vessels is not the same from time-to-time or place-to-place.
Predicting Freight Rate Movement
Asian coal for power generation is primarily traded in Panamax and Capesize tonnage. In Europe, steam coal is primarily imported using Panamax tonnage. The smaller Supramax and Handysize vessels usually have on-board cranes designed for single-deck operations, because the infrastructure at their unloading terminals is usually insufficient for unloading the vessels. In the freight rate discussion that follows, it should be recognized that for Panamax and Capesize vessels, the focus is on the rates for gearless bulk carriers.
A predictor for freight rate movement and for general economic health is the BDI, which is a number issued daily by the London-based Baltic Exchange. Not restricted to Baltic Sea countries, the index provides an assessment of the price of moving the major raw materials by sea. Taking in 23 shipping routes measured on a time charter basis, the index covers Handysize, Supramax, Panamax, and Capesize dry bulk carriers carrying a range of commodities such as coal, iron ore and grain.
The current doldrums in freight rate volatility began when the BDI plummeted in late 2008, taking with it daily charter rates that had been at astronomically high levels for a two-year period. On May 20, 2008, the index reached its record high level of 11,793 points. Since its introduction in 1985, it had not moved above 2,000 until 2003. On February 3, 2012, the index had dropped to 647 points, the lowest since 1986. Until very recent months, the BDI again had not exceeded 2,000 points since 2010. Daily rates reached $160,000 at the peak BDI in 2008, and have fallen to less than $20,000 for the last few years. Many shipowners have been torn between lay-up and scrap decisions.
Coal shippers who had not been competitive due to sea distance began to see opportunities that had not existed when daily rates were exceedingly high. Daily rates never recovered to those excessively high levels. Excess supply of dry bulk vessels would not go away with a short-term surge in coal and iron ore demand.
The Baltic Exchange acts as the global marketplace for brokering shipping contracts. Unlike the publicly traded exchanges, the Baltic is owned and operated by the member buyers and sellers. In addition to this, the Baltic does not allow speculative players to trade on its exchange. The exchange maintains prices on several routes for different cargoes and then publishes the BDI as a summary of the entire dry bulk shipping market. This index is very important as it can be interpreted as one of the more accurate leading economic indicators.
The BDI is also a compelling indicator because it is a simple, real-time indicator that is difficult to manipulate. The BDI is driven by clear forces of supply and demand. It is affected by such items as fleet supply (availability of suitable ships), commodity demand, weather, bunker (crude oil) prices, port congestion, and required routing. The supply that affects the BDI is the supply of ships available to move materials around the globe. It is difficult to manipulate or distort this supply because it typically takes three to four years years to build a new ship that could be put into service to increase supply, and it would cost far too much to leave ships empty in an attempt to decrease supply.
The Lesson Many Cannot Learn
When daily rates began climbing into the stratosphere in 2006, a number of investors, mostly shipowners, thought it would be a great idea to own more ships. New orders for bulk carriers, normally less than 30 million DWT per year, jumped to 39 million DWT in 2006, 162 million DWT in 2007, and 91 million DWT in 2008. COSCO, the Chinese government-owned shipping company, jumped on the bandwagon by ordering 10 of the 300,000-ton class, while Vale, the Brazilian ore company, ordered 35 of the 400,000-ton “Valemax” vessels. According to shipbroker RS Platou, the bulk carrier fleet more than doubled between 2004 and 2013, from 297.4 million tons to 670.7 million tons. What happens when greater supply chases unchanging demand? Prices go down — Economics 101. Unless demand for major commodities (coal, iron ore, grain) goes up and stays up, it looks like downward pressure on rates will last for a very long time.
 Guesstimating Rates
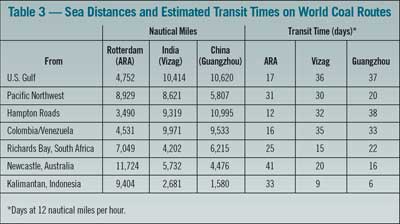
One would expect that if the daily rate is known from the loading port to the discharge port, one could “guesstimate” the rate per ton, but it’s not quite that simple. As Table 1 shows, the parties negotiated an extra fee called a ballast bonus. However, if one knows comparative transit times, as shown in Table 3, one can determine their relative ability to compete with other coal sources. U.S. Gulf, for example, competes well with Colombia/Venezuela to any of three discharge ports.
Dave Gambrel is a coal transportation consultant doing business as Logisticon Inc. Prior to his consulting career, he was director of transportation for Peabody Coal, and chartered more than 50 vessels of Panamax and Capesize classifications. Email: bunkgambrel@earthlink.net.

