The first few pages of this edition of Coal Age sum up the current state of the coal industry. Most of the headlines announce bankruptcies and layoffs as U.S. coal production continues to fall. The question is not whether it is bad in any coal producing region, but how bad is it? While 2015 started off well, by the end of the year, it seemed that every coal operator was affected by the declining market.
Utility coal consumption declined significantly in 2015. Overall, electrical demand was much lower and coal faced stiff competition from natural gas. Spot prices for eastern U.S. coals have dropped to their lowest levels in at least five years. Prices for oil and natural gas remain at seven-year lows, and a mild winter could spell more problems for energy producers in general and coal operators specifically.
From a regulatory standpoint, nothing has changed. Despite the fact that the Supreme Court ruled against the Environmental Protection Agency (EPA) on its Mercury and Air Toxic Standards (MATS) in late June, the damage has been done. Undeterred, the Obama admin-istration and the EPA continue to wage war against coal use, rolling out the Clean Power Plan to the industry’s dismay.
Every January, Coal Age publishes its Annual Forecast based on a survey of its readership. The informal study gives an assessment of the current market situation, as well as the state of mind among coal operators. Based on that information, and data from the leading coal companies, the Energy Information Administration (EIA) and the Edison Electric Institute, Coal Age tries to project market trends.
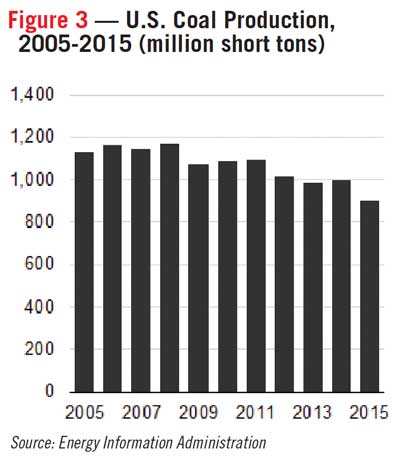
In last year’s Annual Forecast, Coal Age thought production had stabilized and predicted U.S. coal production would struggle to remain above 1 billion tons. The market slide that occurred during 2015 blew that forecast out of the water. According to preliminary figures from the EIA, U.S. coal production totaled 888 million tons during 2015, an 11% decline over 2014 and the lowest level since 1986. Coal production averaged 17 million tons per week in 2015 and with a week or so uncounted for, the final official production figures will likely be slightly more than 900 million tons.
 In addition to supply and demand fundamentals, the survey asked coal operators about their feelings, the amount of money they plan to spend this year, and how they intend to spend it. Considering the situation some of them face, especially in southern West Virginia, they feel betrayed. The American coal operator is more pessimistic than ever before. They have money to invest on projects, but they have to justify those projects.
The survey also asked them to rank issues affecting the industry. A similar open-ended question, designed to identify possible overlooked issues, elicited an overwhelmingly similar set of responses that singled out the Obama admin-istration, the EPA and other federal agencies as anti-coal. They are hostile toward the Obama administration and they are saddened by Washington’s current energy policy.
REDUCING COSTS
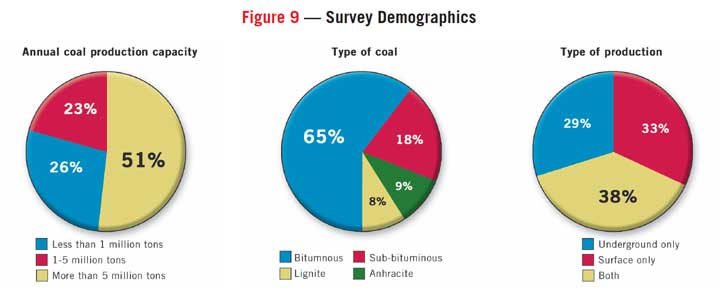
Coal Age contacted 500 coal executives and received 79 completed surveys. The demographics largely resemble the U.S. coal industry. The majority of them (65%) produced bituminous coal. Subbituminous, lignite and anthracite accounted for 18%, 8% and 9%, respectively. As far as production capacity, most of the respondents represented large mine operators (more than 5 million tons, 41%), followed by small (less than 1 million tons, 26%) and medium (1-5 million tons, 23%); 33% described themselves as surface coal operators exclusively, while 29% said they only operated underground mines. The remainder (38%) said they worked for a company that mined coal using both surface and underground techniques. Similar to years past, most of the respondents said their coal went to electric utilities (77%). The remainder said their coal was destined for steel mills (15%) or industrial boilers (8%). Power generation remains the overwhelming use for the majority of U.S. coal production.
Going into 2016, the survey revealed that coal operators are more pessimistic than ever before. A total of 71% (vs. 54% last year) described their attitude as negative, while fewer were more optimistic (10% vs. 18%). Last year, 28% said they were ambivalent, and that number declined to 18%. The overall mood in coal country has grown considerably darker in one year’s time.
Confirming that feeling, 68% of the respondents thought their coal production would decrease in 2015, compared to 33% last year. Equal numbers (16%) believed their coal production would increase or remain the same, compared with 30% and 37% last year, respectively.
Coal mining is a capital-intensive business. For 2016, more than half of the respondents (59%) said their capital budgets would decrease, which was up slightly from last year (54%). Only 16% reported a capital budget increase, another negative sign compared to 26% last year. A quarter of the respondents said their budgets would remain the same, compared to 21% last year. Looking at the data from a glass-half-full perspective, one could say 41% see their capital budgets staying the same, with some seeing an increase.
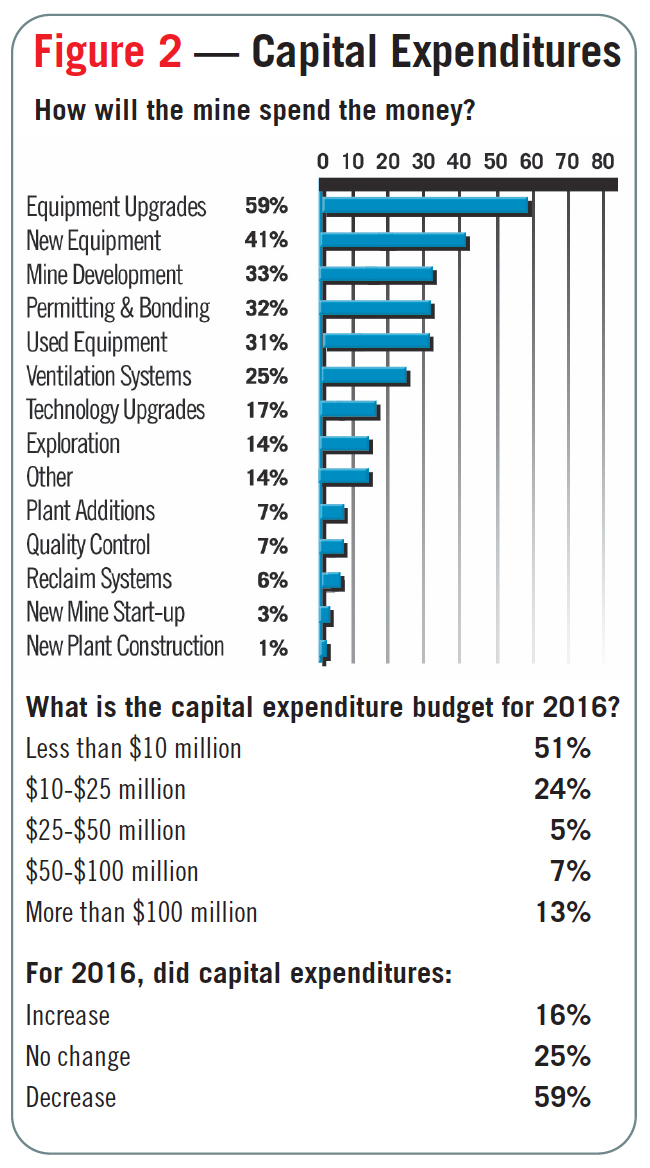
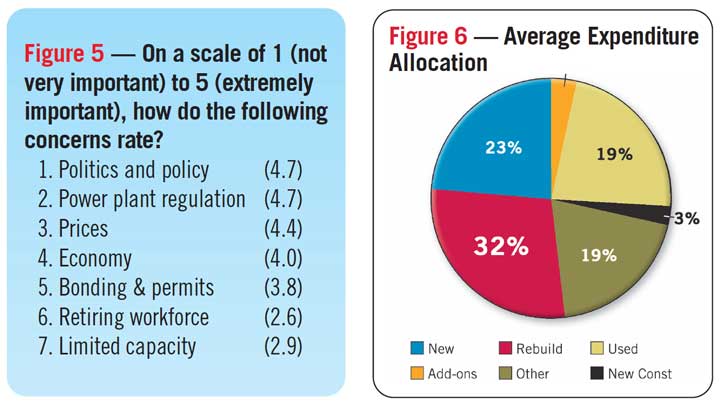
When asked how they would spend the money, they said equipment upgrades (59%), new equipment (41%), mine development (33%), permitting and bonding (32%), and used equipment (31%). Equipment upgrades have remained a priority for five consecutive years now. When asked how their money would be allocated on a percentage basis, the majority of the respondents (32%) said their money would be spent on equipment rebuilds (see Figure 6). Spending on new mine/plant construction and plant additions fell to low single digits of 3% and 4%, respectively.
When asked about their capital budgets, 51% of the respondents reported they would spend less than $10 million this year. A total of 13% said they would spend more than $100 million; 24%, $10-$25 million; 5%, $25-$50 million; and 7%, $50-$100 million. Those that are going to spend are going to spend less. This year, only 25% will spend $25 million or more. Last year that figure was 37%.
Coal operators will invest in operations and equipment to reduce costs. With coal prices as low as they are, it’s one of the few remaining levers they have.
Coal operators are frustrated. When asked: What will affect the U.S. coal industry the most and how should it prepare? Many of the responses cited cheap natural gas, the EPA and the Obama administration. When asked “which of the 2016 presidential candidates best understands America’s energy needs and the importance of coal?” the answers favored the Republican party and followed current national polling trends: Donald Trump (48%), Ted Cruz (16%) and all others were in the single digits, including Hillary Clinton (5%) and Bernie Sanders (0%). Several respondents pointed out that none of the candidates have expressed a true understanding of America’s energy needs.
When asked about what specific issues will affect the coal industry most in 2016, politics and policy and power plant regulation scored the same high scores (4.7/5) as the leading concerns. Coal prices remained ahead of the economy. Reading between the lines, the miners are saying that prices and the economy do not matter if their customers are not allowed to burn coal. Limited production capacity and a retiring workforce was the least of their concerns.
WHAT TO EXPECT IN 2016 AND 2017
The 2015 drop in coal production, which was the largest annual decline, occurred in all coal-producing regions. The Appalachian region took the biggest hit with a 13% decline. Southern West Virginia saw coal production decline by 18% while northern West Virginia declined by only 4.4%.
Production in the Interior region, which includes the Illinois Basin, declined by 10.5% in 2015 — the first decline since 2009. Production in western Kentucky and Indiana fell by 14% and 12%, respectively, while Illinois output only fell by 3%.
Western region production declined by 10.6%, with production falling below 500 million tons for the first time since 1998.
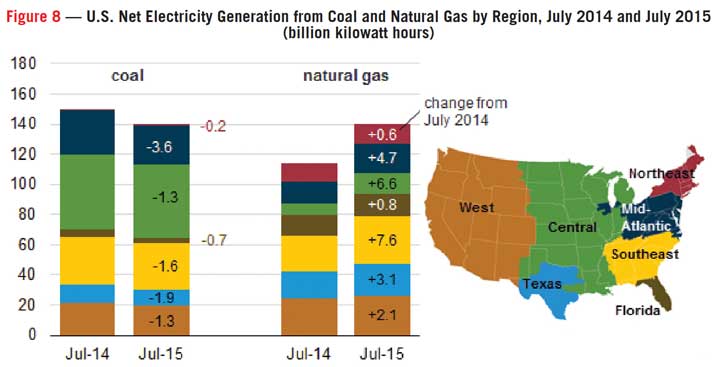
Coal production is a function of consumption and the amount of coal consumed to produce electricity fell by 11% in 2015. Lower natural gas prices were a primary factor. As the accompanying chart shows, coal consumption for electricity generation declined year-on-year in every region while gas consumption for electrical power generation grew in every region.
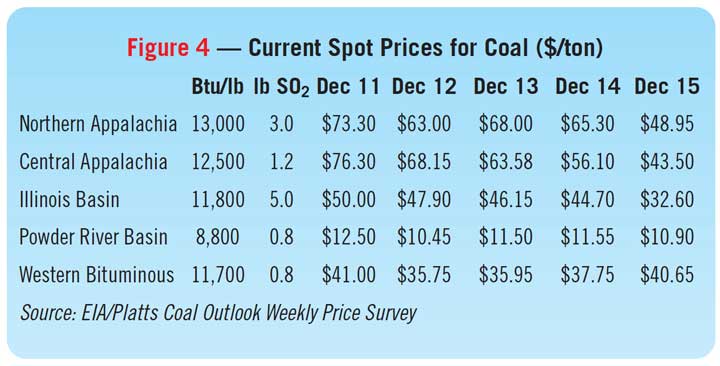
Naturally, these soft market conditions will act to hold down prices for prompt delivery. With the exception of Western bituminous, spot prices for coal fell across the board in 2015 (see Figure 3). By the end of 2015, spot prices for Northern Appalachian coal had dropped 25% to $48.95/ton from $65.30/ton at the same time last year. Spot prices for Central Appalachian coal dropped 22% to $43.50/ton from $56.10/ton. Spot prices for Illinois Basin coal dropped 27% to $32.60/ton from $44.70/ton. Prompt prices for Powder River Basin coals dropped nearly 6% to $10.90/ton from $11.55/ton. Meanwhile, prices improved for Western Bituminous coals moving up to $40.65/ton from $37.75/ton one year ago.
Retirements of coal-fired power plants, stemming from both increased competition with natural gas generation and the implementation of MATS, also reduced coal-fired generation capacity, but the full effect will not be evident until 2016, according to the EIA. Coal consumption for electrical power is expected to remain at 2015 levels, a little more than 750 million tons, for 2016 and 2017.
Coal stocks remain relatively high, at 176 million tons in October. October inventories averaged 155 million tons during the previous 10 years, according to the EIA.
A similar trend is visible in international markets. Slowing growth in world coal demand and low coal prices have also had an impact on U.S. coal exports. Lower transportation costs and a strong dollar will not help U.S. exports over the next few years. The EIA estimates U.S. coal exports decreased 20 million tons (21%) from 2014 levels to 77 million tons in 2015. The EIA is forecasting an additional 9 million tons (12%) decline in 2016 and a further 2 million (4%) decline in 2017.
In its Short Term Energy Outlook, the EIA said U.S. coal production will continue to decline over the next two years. Production is expected to fall to 852 million tons in 2016 (4%) in 2016 and 843 million tons (1%) in 2017.
Interior region production, which accounted for only 13% of coal production 10 years ago (2006), is projected to account for 20% of production in 2016 and 2017. This increase in share reflects the region’s growing competitive advantages compared to the other coal-producing regions. These factors include a higher calorific value for the coal, proximity to the power plants, and lower mining costs.
Appalachia, which accounted for 34% of production 10 years ago, is projected to decline to 24% in 2016 and 2017.
The Western region’s share, which was 53% 10 years ago, will increase to 56% in 2016 and 2017.
The U.S. economy is powered by electricity, and electrical demand will only increase significantly when America experiences a true economic recovery and the manufacturing sector begins to grow again. In the meantime, power producers hold the cards with excess capacity and they will choose the least expensive fuel that meets their need.