

Figure 1 — Monthly violations totals.
Does the past foretell the future?
by mark savit
We have a new administration and, like many in the industry, I have some trepidation about what the future might hold for the Mine Safety and Health Administration’s (MSHA) relationship with those it regulates.
But, as Phaedrus is reported to have said, “Things are not always what they seem; the first appearance deceives many; the intelligence of a few perceives what has been carefully hidden.” Rather than depending on “the intelligence of the few,” we have broken down the numbers from past administrations from 2000 to the present to get a glimpse of what we might expect. That breakdown also unearthed some insight into how MSHA enforcement has affected mine health and safety in the recent past.

Figure 2 — Monthly violations by industry sector.
Let’s start with a bit of background. Don’t expect to see a new assistant secretary for mine safety too soon. Dave Lauriski wasn’t confirmed until May 2001, five months after the election. There was a 10-month gap between the end of his term and the beginning of Richard Stickler’s term and, although the
administration changed parties in 2008, Stickler stayed in office until October 2009 when Joe Main was appointed. Main left office with the change of administrations in January 2017, but current Assistant Secretary Dave Zatezalo wasn’t confirmed until November of that year. Also, just in case you thought us miners were getting the short end of the stick for having to wait, I would remind everyone that there was not a confirmed assistant secretary at the Occupational Safety and Health Administration (OSHA) for the entire former President Donald Trump administration. The agency was headed the entire time by Principal Deputy Assistant Secretary Loren Sweatt, who started in July 2017.

Figure 3 — Number of mines versus total citations.
As to who the new assistant secretary might be, that’s anyone’s guess. Given the amount of time that normally passes between an administration change and the appointment of a new assistant secretary, it’s still too early in the game to get a good idea. If the past is any indicator, we can look to two things. First, the assistant secretary has always come from the coal side. As of MSHA’s last count (2019), there are slightly more than 10 times as many non-coal mines as there are operating coal mines in the U.S., but there are more inspection days and penalty dollars per coal mine than there are per non-coal mine. Second, 11 of the 29 members of the President Joe Biden transition team for the Department of Labor are either employed by unions or by union affiliated organizations.
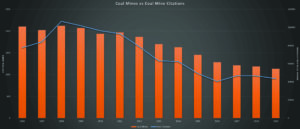
Figure 4 — Coal mines versus coal mine citations.
Biden’s nominee for labor secretary is Marty Walsh. He is currently the mayor of Boston. Before that, he was president of Laborer’s Union Local No. 223 and the Boston Metropolitan District Building Trades Council. Both he and Biden have issued statements suggesting that one of their shared goals is increasing union membership and strengthening workers’ rights. While that may or may not be significant in and of itself, it should suggest the type of folks that will ultimately form the pool of candidates for MSHA assistant secretary.
Looking at the Numbers
Using software built to support our Predictive Compliance analytical tool along with additional public MSHA data, we did an in-depth analysis of enforcement trends over the last 20 years. We start with a look at the total violation counts from 2000-2019. We’ve left out 2020, because we’re only counting final orders and many of the citations issued in 2020 have yet to be resolved.

Figure 5 — Metal/nonmetal mines versus metal/nonmetal citations.
We’ve added the start and end of each assistant secretary for MSHA as benchmarks (See Figure 1). As you can see, there are a number of rises and dips, but overall, total citations remained about even during Lauriski’s tenure, but then begin a fairly steady rise until 2008, then
the number starts to steadily decrease starting in 2010. While one might attribute that to a change in administration, a closer look reveals it may be more attributable to serious mine accidents that took place during the period. Here is the same chart with major mine accidents shown on it and coal separated from metal/nonmetal (See Figure 2).
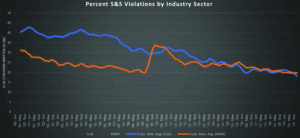
Figure 6 — Percent of citations that are S&S by sector.
What seems obvious from this view is that the rise in total violation count appears to be driven by the major accident events at coal mines than anything else. However, it is curious to see that the steady decline in coal enforcement actions between 2008 and 2019 begins almost two years before the Upper Big Branch mine explosion in April 2010, while the decline in metal/nonmetal doesn’t start until significantly later, in September 2010.
Of course, there’s been about a 9% decline in the total number of mines since 2010. But the number of total violations has declined during the same period by 42% (Figure 3). In other words, the decrease is most likely attributable to something
other than the decline in the number of mines.
Broken down by coal and metal/nonmetal, the differences are no less dramatic. The number of coal mines declined by 42% while enforcement actions declined by a little more than 51% (See Figure 4). Similarly, metal/nonmetal mines declined by only 4% while enforcement actions declined by approximately 30% (See Figure 5).
With one notable exception, the number of S&S citations as a percentage of the total has also declined steadily during this period. The best way to illustrate what both the decline and the exception is to show the coal and metal/nonmetal numbers together.

Figure 7 — Days lost versus violation totals by sector.
It is worth noting the percentage of significant and substantial (S&S) citations issued to metal/nonmetal mines ran about 10 points below the percentage of S&S citations issued to coal mines until mid-2008, when it started to rise dramatically to almost exactly the same S&S percentage as coal. The charts below demonstrate the rise was unrelated to any significant change in the accident rate or any particular event, but coincides almost exactly with the change of assistant secretaries from Stickler to Main. The numbers demonstrate that the rise in the S&S percentage for metal/nonmetal mines was triggered by change in administration and a policy decision to bring those percentages closer together (See Figure 6).
Now that we’ve looked at the enforcement numbers, the inevitable question is whether the rise and/or fall of MSHA enforcement actions has any effect on safety. The next three charts (Figures 7, 8 and 9) tell the story.
These charts demonstrate a steady drop in days lost starting in 2002, which appears unaffected by any of the rises or falls in MSHA actions. Since the number of miners dropped during the period, we ought to look at the rates to see
if the drop in days is attributable
to the drop in the number of mines. It is not, and importantly, it is also independent of the various ups and downs in MSHA enforcement actions.

Figure 8 — Days Lost vs S&S percentage by sector.
Taken as a whole, these numbers show the improvement in safety in U.S. mines is largely independent of MSHA enforcement trends. One of the key indicators of this is the steadily declining percentage of S&S citations (See Figure 6). Remember that S&S citations are only issued when the alleged violation is reasonably likely to cause an accident and that accident is reasonably expected to result in a serious injury. In other words, the percentage of citations based on conditions that are not reasonably related to a hazard has risen. It is getting harder and harder for MSHA to find violations that look to be reasonably related to the causes of accidents. The inverse of this S&S percentage decline means the percentage of citations issued for more “technical” violations is rising and the agency appears to be focusing more and more on enforcement for its own sake.
There are several possible reasons for this. I have written about many of them over the years and there’s neither time nor space for explications of each in this article, but here are two factors that might explain the numbers we just looked at.
The 1969 Coal Act, which forms the entire enforcement strategy of the 1977 Act, is based on a labor-management model that is more than 50 years old. No one manages their workforce the same way they did in 1969, and it makes no sense to persist in using that as a basis for our regulatory model.
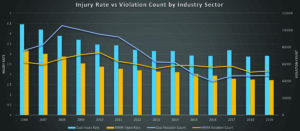
Figure 9 — Injury rate versus violation counts by sector.
The same is largely true of the regulations. A great deal of them were adopted in the 1970s and 80s from practices developed in the 60s and in some cases the 1940s and even earlier. With limited exceptions, there has been no organized attempt to make the vast majority of regulations relevant to modern methods or technology.
What’s MSHA’s take on this? It is hard to tell, but one statistic stands out. Let’s look at the number of Section 103(k) orders over the same period (See Figure 10). For those of you who might not be familiar with that section of the Act, it allows MSHA to issue orders of withdrawal in the case of an accident. Given the decline in total lost days and accident rates, one would logically conclude that the number of Section 103(k) orders would have declined as well. The numbers, however, show otherwise.

Figure 10 — 103k orders verus total lost days.
After a truly epic boost in the number of orders issued between 2004 and 2011, there were actually more 103(k) orders issued in 2019 than there were in 2000. While this appears to make no sense, there actually might be a logical explanation for it. Under Section 103(k), MSHA can require operators to adopt a plan, which MSHA must approve, before resuming operations. Increasingly, MSHA is using Section 103(k) to require operators to adopt practices that either differ from or go far beyond those required in the regulations. In other words, rather than engaging in an organized, research-based revision of its regulations, MSHA appears to be taking an opportunistic, catch-as-catch-can approach; requiring what it can get away with when the opportunity arises on a mine-by-mine basis.
There are multiple messages in these numbers. But the overarching conclusion has to be that the Act and the regulations are becoming less and less relevant to the truly remarkable progress we have made to date. If we want to get to the proverbial “next level,” we are going to have to do things differently. My suggestion is that MSHA consider gathering experts from all sectors — industry, labor, government and academia — to fully and frankly discuss collaborative approaches to the goal we all want — greater safety and health for our nation’s most valuable resource, the miner.
Mark Savit is president, Predictive Compliance, a software as a service (SaaS) company that assists mining companies with compliance reporting. Prior to this, he was an attorney representing mining companies and resolving regulatory disputes.