
America’s largest coal consumer surveys the coal business and determines it is headed in the right direction
By Andra M. Nessing, Managing Director of Sustainability, American Electric Power, and R. Larry Grayson, Retired Professor, Penn State University (consultant)
American Electric Power (AEP) recently conducted a survey as part of its overall dedication to corporate sustainability, which also included the performance of its supply chain. The largest U.S. coal consumer wanted to learn more about the environmental, safety and health performance of its coal suppliers. In the process, the suppliers received data that gave them a broader view of industry performance. The survey results were shared with suppliers, and a final report is publicly available on AEP’s sustainability web site (AEPsustainability.com). This is the only known survey of the coal industry providing a broad perspective of the coal industry on issues which the coal industry is often publicly judged on.
AEP uses the Global Reporting Initiative (GRI) framework for reporting its sustainability performance. Although GRI is a broad framework, AEP also reports on indicators specific to its industry (GRI’s Electric Utility Sector Supplement). In gathering the data from its coal suppliers, AEP is attempting to be consistent in its reporting and data collection process. Therefore, some of the questions in the survey come from GRI’s Mining and Metals Sector Supplement (MMSS) to allow for comparability and establish a framework that lends credibility to the survey.
Although the coal industry is a diverse sector with a wide range of business types and models, these guidelines give sustainability reporters an opportunity to describe their scope of operation. The performance indicators developed for this sector focus on issues such as the control, use and management of land; the contribution of a mining operation to national economic and social development; labor relations; community and stakeholder engagement; and environmental management. AEP believes these are relevant to helping us better understand some of the issues we are frequently asked about regarding mining operations and address the expectation that AEP can influence such operations in a more comprehensive and positive manner.
Sources of Data
In 2011, AEP sought to provide a more comprehensive look at the available safety and health data and to perform more concise comparisons to national averages utilizing all available data. AEP sought both quantitative and qualitative types of data for the analysis of safety and health performance. The primary source of quantitative data was the national database maintained by the Mine Safety and Health Administration’s (MSHA) Open Government Data Sets. This data provided the ability to compare results across an industry using consistent, standard measures of performance, which is critical to identifying trends, issues of concern, best practices and opportunities for improvement. To maintain the consistency and quality of the data retrieved from the MSHA database, AEP chose to gather all pertinent safety and health data rather than request each individual supplier to provide the data. AEP’s collection of data provided an independent verification of the data, which was an issue raised in an earlier stakeholder meeting.
The second type of safety and health data sought by AEP in the survey was more qualitative and dealt with formal safety and health programs and the specific components of those programs, such as wellness programs; safety and health incentive programs; an audit program, including its frequency; a formal ergonomics program; employee participation in the programs; additional safety training; Job Safety Analysis (JSA); risk assessment reports; and safety information management systems.
There is more difficulty establishing trends, comparing performance, establishing statistics or identifying best practices with environmental performance. Unlike MSHA, a national database of environmental performance data is not maintained at the federal level. The Office of Surface Mining Reclamation and Enforcement (OSM), the enforcement agency under the Surface Mining Control and Reclamation Act of 1977 (SMCRA) within the Interior Department, does not maintain a historical record of noncompliance.
Furthermore, the enforcement of federal law is through the states that have coal mining operations and who elect to be the primary enforcement agency. OSM provides oversight to the various primacy state programs, but the programs are individually managed by the states and have widely varying nomenclature and are very difficult to compare. The statistics that are maintained only include the outstanding or unabated violations, making comparisons on a nationwide basis nearly impossible. During 2009, AEP explored many of the state programs to determine the availability of statistical information. The findings ranged from fully computerized, publicly accessible databases, to some states that would have to respond to statistical queries by manually researching their internal files. The other environmental portion of the survey included three specific sections on environmental programs, environmental impact and environmental compliance.
Structure and Process of the Survey
The survey collects the following information/data:
- Background information;
- Safety and health information; and
- Environmental information.
The process for conducting the survey involves an initial outreach to AEP’s suppliers, which precedes the survey request. The design, analysis and final report of this survey is a joint effort between AEP’s fuel procurement group, its corporate sustainability team and Dr. Larry Grayson.
 Historical Performance Metrics and Discussion of Results
AEP annually asked 27 to 29 coal suppliers to complete the survey; 11 to 13 responded. The suppliers entered information on 32 to 58 mines and two to 10 facilities with MSHA identification numbers. Of the mines, 10 to 26 were underground and 22 to 32 were surface. Geographically, the mines stretch from the Gulf Coast to Wyoming and as far east as Pennsylvania. Four of the six major U.S. coal-producing regions were represented in the surveys. Coal provided by respondents to AEP ranged from 42 to 59 million tons per year (tpy), or 79% to 95% of the coal provided by all suppliers.
The survey results provide an excellent snapshot of the environmental, safety and health performances of the U.S. coal industry, as it annually represented 40% to 46% of the total coal mined in the U.S. during the survey period. It also reflects excellent, sustained performance by the coal industry — according to six years of data that have been collected and analyzed.
Background Information
In an effort to understand the localized nature of the labor force, as indicated in GRI’s MMSS, respondents were asked to identify the proportion of the workforce that lived within 50 miles, 75 miles and greater than 75 miles of the mine. Results in 2013, and generally for the survey period, reflect that coal mining employment is highly localized. Of those responding, 82% of mine employees live within 50 miles, 12% live between 50 and 75 miles, and the remaining 6% live greater than 75 miles from the mine.
In 2013, the total tonnage currently under permit by respondents was 5 billion tons. Additional permitting is under way for 14 of these mines with an additional tonnage of 606 million tons, or 12% of the total current permitted tonnage. Post-mining land use was indicated for 31 different permits comprised of 54.8% agricultural use, 32.3% forestland/fish/wildlife uses, and 12.9% “other” uses. There were only two mines indicating a variance from reclaiming to the Approximate Original Contour (AOC). One mine indicated the post-mining land use would be “agricultural/grazing/pasture” while the other one was granted for a steep slope area. None of the mines with a variance from AOC stated the reason for the variance to be related to mountaintop removal.
Table 1 shows the distribution of surface mining methods for the primary method of extraction. In some mines, multiple methods of extraction are used, and Table 2 reflects the secondary methods used. Six of the mines used more than one method, while five of them used two secondary methods. Of the four responding surface mines within Central Appalachia (CAPP), which provided sufficient information, both reported the method of surface mining used in 2013. Of note over the period of the survey, the use of mountaintop removal gradually decreased until none was done by AEP suppliers in 2013.
Citation Results
To review and more accurately compare the data, mines were analyzed by size category and the numbers of citations (regular, significant and substantial (S&S) and order types) were divided by inspection hours and then normalized by 100 inspection hours. Mine-size categories used in the data review were large (100 or more employees), medium (50 to 99 employees), small (20 to 49 employees), and very small (less than 20 employees).
The six-year trends for AEP large underground mine suppliers’ serious citation rates and their comparison with national averages are given in Table 3. For AEP suppliers, the overall six-year trend shows a steady decrease in the significant and substantial rate (SS/100 IH) and the order rate (O/100 IH) from 2009 through 2013, which generally reflects the national trend as well.
Notably, the AEP supplier rates are consistently much lower than the national rates, with the exception of 2009. Results for medium-size underground mine AEP suppliers are given in Table 4. Significant improvements of the rates were achieved since 2009, with AEP supplier average rates being less than the national average rates during 2010-2012.
The six-year trends for AEP underground small-mine suppliers’ rates and their comparison with national averages are given in Table 5. Notably, the AEP supplier rates are consistently lower than the national rates, showing a steady decrease from 2009. There were no very small mine suppliers to AEP in 2011, 2012 and 2013.
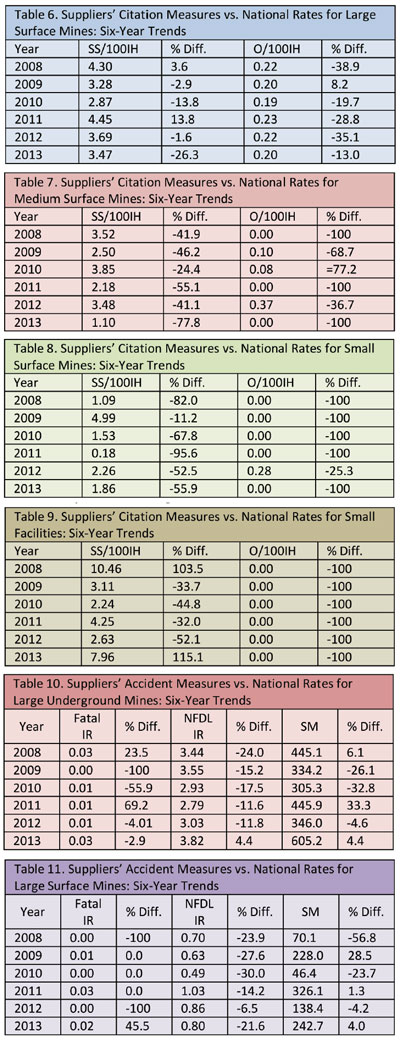
The six-year trends for AEP large surface mine suppliers’ serious citation rates and their comparison with national averages are given in Table 6. Similar to the previous results, the AEP large surface mine suppliers’ rates are consistently lower than the national rates, except for the O/100 IH in 2009 and the SS/100 IH in 2011, however, performing at a relatively constant rate over 2008-2013.
The six-year trends for AEP medium-size surface mine suppliers’ serious citation rates and their comparison with national averages are given in Table 7. The table shows that the AEP medium-size surface mine suppliers’ rates are much lower than the national rates during the period 2008-2013. In fact, in 2008, 2011 and 2013, the mines’ rates were zero.
The six-year trends for small surface mine AEP suppliers’ serious citation rates and their comparison with national averages are given in Table 8. The table shows that the AEP small surface mine suppliers’ rates are much lower than the national rates during the period 2008-2013. No very small surface mines shipped coal to AEP in 2012 and 2013, and only one did in 2011.
For the 2013 large and medium-size facilities, there were no AEP suppliers, and only one in 2012; thus, no statistics on trends are presented.
The six-year trends for small facility AEP suppliers’ serious citation rates and their comparison with national averages are given in Table 9. The table shows that the AEP small facility suppliers’ rates are much lower than the national rates during the period 2009-2013, with one exception in 2013 for SS/100 IH, which was higher. Only one very small facility provided coal to AEP in 2012 and 2013; thus, no six-year trends are given.
Accident Rates
Another survey component for demonstrating safety was a review of suppliers’ accident rate statistics. These statistics provide a general basis for evaluating the mine operator’s safety program, regulatory enforcement actions, and employee actions to prevent accidents. The metrics included the non-fatal days lost incident rate (NFDL IR), the Severity Measure (SM) and the Fatal Incident Rate (Fatal IR). All rates are normalized by 200,000 employee hours.
The six-year accident trends for AEP large underground mines, as compared to national averages, are given in Table 10. The table shows that large underground coal suppliers’ accident rates are generally better than the national rates, particularly for the NFDL IR, which was comparatively better in all years, except 2013 when it was slightly higher.
The suppliers’ Fatal IR was elevated in 2008 and 2013, but fatalities generally occur at low rates across the industry, with a 0.01 and 0.02 incident rate predominating. Note that the severity measure incorporates statutory charges of 6,000 days for a fatality, and variable days for different levels of disability. As a result, a relatively high Fatal IR also impacts the severity measure significantly; hence, the apparent correlation of both the Fatal IR and the SM in exceeding the national rate in 2008 and 2012.
It is also noted that the severity measure does incorporate other serious accidents well, and therefore is more comprehensive in revealing the severity of a mine’s injuries and illnesses. It is also noted, however, that the large underground mine coal suppliers’ Fatal IR was better than the national average in four of the last five years, and the SM was better than the national average in three of the six years and only slightly higher in the two other years (2008 and 2013). For the Fatal IR, they were significantly better than the national average in 2009, 2010, and 2012, and the Fatal IR was at 0.01 or 0.00 in four of the last five years. Regarding the SM, they were significantly better in 2009 and 2010 and somewhat better in 2012. No medium-size and very small underground mines provided coal to AEP in 2013, and only one small mine did. No small and very small mines provided coal to AEP in 2012; thus, no six-year trends are presented.
The six-year accident trends for AEP large surface mines, as compared to national averages, are given in Table 11. Notably, the Fatal IR was zero in three of six years, and the AEP suppliers’ Fatal IR was better than the national average in two years and higher in 2013 (one fatality). The AEP suppliers’ NFDL IR was better than the national average in all six years, while the SM was better than the national average in three years, and only slightly higher in 2011 and 2013, while 28.5% higher in 2009. Altogether, this is an excellent sustained safety performance.
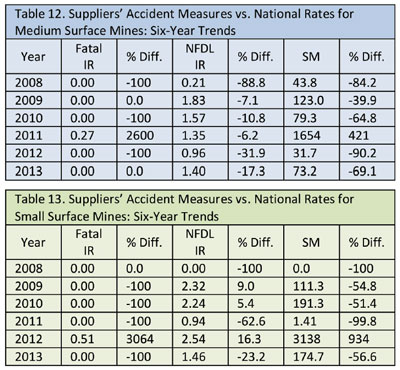
The six-year accident trends for AEP related to medium-size surface mines, as compared to national averages, are given in Table 12. In all years, except 2011, the accident performance of the medium-size surface mine suppliers was far superior to the national performance. There were no fatalities in these mines in five of six years, and the NFDL IR was consistently lower than the national average every year. The SM was also significantly lower in these mines in five of six years, but in 2011 there was a single fatality nationally in this mine-size category, and it occurred in one of the supplier mines. This demonstrates the impact of a fatality on an operation and the importance of strong safety programs, as the number of fatalities continues to diminish nationally.
The six-year accident trends for AEP small surface mine suppliers, as compared to national averages, are given in Table 13. In all years except 2012, the accident performance on the Fatal IR and SM of the small surface mine suppliers was superior to the national performance. There were no fatalities in these mines in five of six years. The NFDL IR was lower than the national average in 2008, 2011 and 2013, and it was near the national in the other three years. As was the case for the fatality in the medium-size supplier mine in 2011, the impact of a fatality on a mining operation is observed in 2012.
There was one very small surface mine respondent supplying coal to AEP in 2013 and none in 2012; thus, no six-year trends are presented.
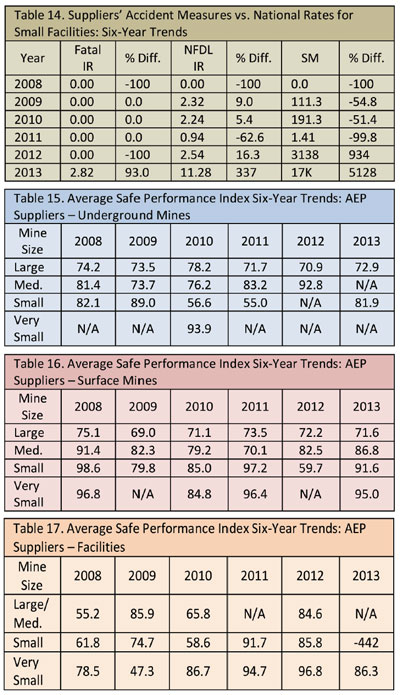
There was no medium-large size facility supplier in 2013 and only one in 2012; thus, no six-year trends are presented. The five-year trends for small facility suppliers to AEP are given in Table 14. For the years 2008-2012, there were no fatalities and the rates for 2011 and 2012 were significantly lower than the national rates for this mine-size category. In 2013, however, a single fatality at the single facility supplier drove the rates significantly above the national averages. This signals the tremendous impact that a fatality has on a small operation’s safety performance. There was only one very small facility supplier in 2012 and 2013, which had no fatality; thus, six-year trends are not presented.
 Safe Performance Index Results
The Safe Performance Index (SPI) is an analysis method that balances the overall mine safety performance by placing equal weighting to the accident and citation performances, but also places higher weightings on the more serious measures within the accident and citation categories. It was developed by Dr. Larry Grayson and was presented before the U.S. House of Representatives. It also has been supported during hearings on the new POV regulation, and has been published in peer-reviewed literature several times. The SPI is used to compare AEP supplier mines with the performances of all mines within mine-size categories. Note that a higher SPI signifies a better overall safety performance, and that the average SPI within a mine-size category is always 66.7.
The six-year trend for each underground mine-size category is presented in Table 15. In only two cases was the SPI somewhat below the structural average of 66.7 (highlighted in blue), both occurring for small-mine suppliers, once in 2010 and once in 2011. In all other cases the average SPI was above the structural average.
The six-year trend for each surface mine-size category is presented in Table 16. In only one case was the SPI somewhat below the structural average of 66.7 (highlighted in blue); it occurred for a small-mine supplier in 2012. In all other cases the average SPI was above the structural average.
The six-year trend for each facility size category is presented in Table 17. There were five cases where the average SPI was somewhat lower than the structural average of 66.7 (highlighted in blue). The SPI for the small facility in 2013 is highlighted in light red. On a positive note, the average SPI was significantly above average in 2011 and 2012 for all size categories.
Overall, AEP’s coal suppliers performed better than the national average for underground and surface mines in all mine-size categories, with very few exceptions. AEP facility suppliers’ performance improved from very good to excellent in 2011 and 2012, but one small facility had a fatality in 2013. Based on all supplier performances, the state of mine safety among AEP coal suppliers is good to excellent during the period 2011-2013. Achievement of the goal of zero fatalities at each site would elevate those mine-size categories that were below the national average to the excellent level achieved by most AEP suppliers.
Health Results
Health provisions under the Coal Mine Health and Safety Act (CMHSA), as enforced by MSHA, generally include two main aspects: respirable dust control and noise control. Of significant concern in underground mining is respirable dust control, which is highlighted by a recent doubling of the rate of dust diseases of the lungs (black lung). Generally, at the great majority of mines surveyed, no significant noncompliance exists. The survey did not identify any underground mines with significant numbers of violations. If a mine received nine or more violations in one year, it would have been categorized as having significant noncompliance.
Affecting both underground and surface mining are the provisions for noise control. No mines had an abnormally high number of noise violations. The qualifying limit was considered to be seven or more violations in one year.
 Health and Safety Program Information
The descriptions of the health and safety programs were diverse. They ranged from programs that went well beyond the norm to those that were more typical and in some cases the minimum required by state regulators.
Of the 11 suppliers responding to the 2014 survey, information was provided on 28 mines/facilities for benchmarking adoption of safety program elements, given below:
- 61% included audits by personnel from outside the immediate mine employees, while 46% conducted audits more than once per year, and 93% included employee participation;
- 100% of the mines offer employees additional safety training above required limits;
- 100% have formal Job Safety Analysis (JSA) programs;
- 57% have Risk Assessment (RA) programs;
- 100% include an Information Management System as part of their health and safety programs; and
- Wellness programs were included in 96% of the mines and 36% had formal ergonomics programs.
Between 2008-2013, there was a dramatic increase in the percent of mines embracing most of the components of health and safety programs.
Environmental Metrics
There is more difficulty establishing trends, comparing performance, establishing statistics or identifying best practices with environmental performance. Unlike MSHA, a national database of environmental performance data is not maintained at the federal level. OSM does not maintain a historical record of noncompliance. Furthermore, the enforcement of federal law is through the states that have coal mining operations and who elect to be the primary enforcement agency; however, most of the states do not have publicly available datasets from which national performance averages could be derived. Nonetheless, the environmental portion of the survey includes three specific sections on environmental programs, environmental impact, and environmental compliance, which facilitate year-to-year comparisons on metrics and determination of performance improvements.
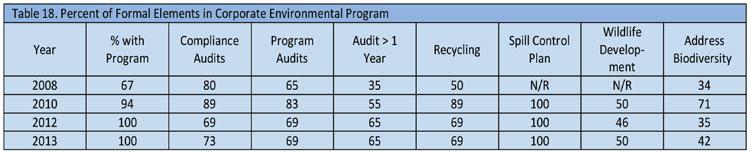
The survey first requested whether a formal environmental program existed, since they are not nearly as prevalent in the coal mining industry as safety and health programs. Table 18 shows the trend of AEP suppliers embracing environmental components over the past three surveys. Overall, there was a modest increase over the previous surveys in the percentage of mines embracing various elements of an environmental program. Notably, the percentage of AEP suppliers with a program has grown to 100%. The percentage of suppliers doing a type of audit more than once a year has nearly doubled, and all of them have SPCCs. The percentages doing audits has increased somewhat, as has planned development of formal wildlife areas and addressing biodiversity in some formal.
This section of the survey focused largely on performance indicators from the MMSS. These indicators measure areas such as mine closure plans, abandoned mine site reclamation, stripping ratio, air emissions, water usage and refuse disposal. Additional information was sought on whether the mine had a formal closure plan that was over and above the plan required by OSM. SMCRA requires a final reclamation plan for all mines, and very few mines have a plan that goes beyond the required reclamation plan. Comparative results are given below:
- 71% of mines used coarse refuse to construct an embankment; none used it for valley fills and one specified use of a combined coarse and fine impoundment disposal. This result is consistent over time.
- 71% of mines use impoundments for fine refuse; one mine indicated mixing of filter-cake fines with coarse refuse; and no mines indicated underground injection of fine refuse. In 2012, 100% placed their fine refuse in impoundments, while in 2008, only 66% of the operations used impoundments and 32% mixed it for disposal with coarse refuse and 2% injected it underground. This is a dramatic and positive change in the disposal of fine refuse.
- Regarding the need for perpetual water treatment (post-mining), only one mine (3.7%) indicated such a need. In 2008, 11% of respondents indicated a potential for perpetual water treatment upon completion of reclamation, while in 2010 it was only 7.5% of the respondents. This result is also a dramatic improvement in removing potential adverse situations with water treatment following reclamation.
- Regarding significant air emissions that required a permit, 43% indicated having such a need. The primary issue was fugitive dust at mines largely in the NAPP region.
Table 19 reveals the data analysis results over the survey period regarding the underground mine/plant reject material. These operations are largely in the NAPP region. From 2008 to 2010, the millions of tons of reject material increased from underground mines, but it decreased significantly in 2012 and increased again in 2013. However, the reject rate has decreased significantly since 2010. Seeing a reduction in the reject rate shows the beginning of a potentially positive trend.
A listing of additional comparative results is given below:
- An average of 258.4 acres was disturbed by surface mines in 2013, with an average of 165.5 acres reclaimed. For preparation plants, an average of 8.9 acres were newly disturbed and 3.5 acres reclaimed. The average acres disturbed in 2012 was 19.1 per operation, and average acres reclaimed was 3.8.
- The stripping ratio of AEP supplier surface mines for 2013 averaged 17.4:1 with a range from 3.6:1 to 23.1:1 cubic yards of overburden removed per ton of coal produced. This increased somewhat from the 16.2:1 stripping ratio average in 2012.
- The annual volume of methane discharged from underground mines in 2013 was 313,436 metric tons, or an average of 78,359 tons per underground mine, which reflects the domination of large mines responding to the survey as compared to 2012 when the average was 48,623 tons/mine. Three mines captured methane before mining, while none of them captured methane after it is released and diluted with mine ventilation.
- The AEP supplier surface mines emitted a total of 498,842 metric tons during 2013, with the vast majority of this (99.5%) being carbon dioxide (CO2). A 9.8% decrease in the average GHG emissions per mine occurred in 2013 as compared to 2012, while the percent of CO2 increased to 99.5%.
- On average, the AEP supplier preparation plants withdrew and used 554.8 million gallons per year of process water in 2013, which was close to the 2012 result. However, 69.4% of this water is recycled for plant use. The most common water sources were impoundments (eight) and ground water/wells (three). The average consumption of process water withdrawn for use and the percent recycled were nearly identical in previous years.
Environmental Compliance
Six-year trends for water quality and non-water notices of violations (NOVs) are shown in Table 20. In 2013, 85% of the mines had no violations. These statistics were dramatically improved over 2012 as was the number of NOVs per mine.
No “patterns of violations” or “show cause orders” and no permit-block actions were reported by the respondents in 2013 due to environmental non-compliance. None of the suppliers reported having had reclamation bonds forfeited. The six-year trends for failures to abate a violation, citations for imminent harm conditions, and bond forfeitures, as well as for these metrics, are presented in Table 21.
Fines assessed in 2013 for environmental violations were reported as numbering 47 with an average of 1.38 per operation. A total of $36,369 of fines was levied in 2013 with an average $1,070 per operation; this is a 57% decrease, which is outstanding. No spills were reported in the survey for 2013. The six-year trends for average violations per mine, the average fine per violation and total spills are presented in Table 22. In 2013, although the average violations per mine increased, the average fine dropped dramatically. The data reveal a progressively better rate of issuance of violations per mine and a sustained improvement in the total spills occurring at the AEP supplier mines. These are excellent performances.
 Conclusions and Future Efforts
The results of the recurring Sustainability Survey of Coal Suppliers demonstrate that AEP’s suppliers generally continue to improve their environmental, safety and health performances with few exceptions. The surveyed mines represent 40% of the coal being mined within the U.S. and demonstrate the broad reach of this survey nationally to include a large portion of the mining community.
The survey has successfully established a baseline for understanding the sustainability status of the majority of AEP’s coal suppliers. This data gives AEP the ability to compare the safety, health and environmental performance of its suppliers against similar suppliers and to use this data to encourage all suppliers to perform to a higher standard. AEP recognizes that suppliers who provided input for the survey questions expended considerable voluntary effort and resources to collect, assemble and input the information requested.
AEP will continue to work toward increasing supplier participation in the survey. However, it should be clear that participation in the survey and survey results will not currently impact procurement decisions. It should also be noted that, although a portion of the results are available through public sources, much of the information is not available, except through voluntary participation. Furthermore, the public data, other than the safety and health data available from MSHA, is only available through records within nine different states’ regulatory agencies.
This survey collects information but does not establish policy or direction for AEP. We believe that the survey is an effective tool that can be used in AEP’s ongoing efforts to encourage sustainable supply chain practices and greater transparency through sustainability reporting among suppliers, as well as help drive continuous performance improvements. At a minimum, each respondent becomes familiar with the parameters used to measure sustainability and has a better understanding of AEP’s expectations of its suppliers.