
DMC monitoring and optimization based on immediate, precise partition curves from radio density tracers
By C.J. Wood and R.F. Wood
The South African diamond industry advanced the concept with the development of synthetic tracers in the 1970s (Napier-Munn, 1985). The concept was considered proprietary, and was not publicized until after the independent development, at the Julius Kruttschnitt Mineral Research Centre in Australia, of density tracers for coal processing operations (Davis et al, 1985). Partition Enterprises is now the principal manufacturer of tracers for the diamond and other minerals industries.
Tracer properties can include ferromagnetism, as an aid to tracer retrieval; and X-ray luminescence, as an aid to automatic retrieval by the X-ray machines, which commonly recover diamonds from gravel which have been preconcentrated in dense medium cyclones (DMCs). Diamond operators commonly work with density intervals of 0.05 RD and, for statistical reliability, with 100 tracers at each selected density over a range to encompass the entire partition curve.
 COAL PROCESSING
The first author and colleagues developed density tracers for coarse coal DMCs and vessels or baths (Davis et al, 1985). The interval between adjacent densities was 0.02 RD. This was reduced to 0.01 RD, as tracers revealed the excellent partitioning of which dense medium separators (DMS) are capable, and it is normal to use 30 tracers at each selected density. Typically, tracers are cubes. Conjecture may suggest that in situations of high cut-point, slabby sinks and high loadings, there may be a tendency for sinking particles to be entrained with floats and carried to overflow. (Note that the residence time for most floating particles in a DMC is only about a second).
The authors are aware of no clear evidence for such entrainment under normal operations. Similar comments do not always apply to dense medium baths and vessels, nor to jigs. To facilitate manual retrieval of conventional tracers from drain-and-rinse screens, it is common to use large density tracers: 32 mm for DMCs with feed topsize up to 80 mm (see Figure 1), and 32 mm or 64 mm in dense medium baths and vessels.
Fine-density tracers are used for spirals and for elutriation-based separators. They are irregularly shaped, with appropriate shape factors, color-coded for density, and available in a range of sieve size fractions.
 RETRIEVAL AND COUNTING
For dense medium applications, conventional density tracers may be retrieved by hand (or by scoop), and the partition curve is defined in less than one hour. Lightweight magnet panels, installed in drain-and-rinse screen launders, proved effective for recovering ferromagnetic tracers as small as 2 mm, but the technology was not widely adopted.
As an example of a small coal application, consider spirals. A steady stream of tracers (usually a mixture of size and density fractions) is metered into the spiral feed over a period sufficient to ensure that even the slowest-traveling particles are being consistently discharged. Product, rejects and middlings are then sampled or, for greater spatial resolution across the trough, a “mouth-organ” sampler may be employed. The samples may be dried, sieved, and representative images may be captured for tracer sorting by color and counting. These procedures can be tedious, and they tend to be used only for research and equipment design purposes.
In one case, comparable techniques were used to develop small-particle partition curves for DMCs in an operating prep plant.
DMC AUDITS
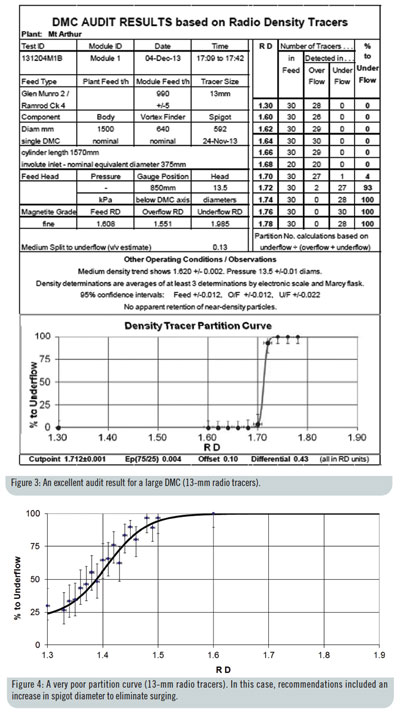
Procedures for generating a DMC partition curve vary depending on the selection of the sizes, densities and numbers of tracers; the tracer partitioning test; interpretation of the results; and operating and other parameters, which should be recorded to facilitate diagnoses and development of recommendations for yield optimization.
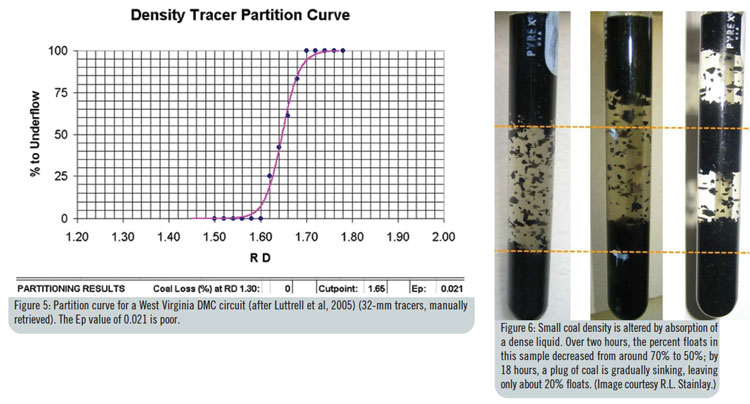
Figure 4 shows the partition curve for a plant suffering surging discharge to underflow, caused by unsustainable buildup of middlings in the DMC. Actions, which could correct the problem, include fitment of a larger spigot; use of finer magnetite; increased contamination of the medium; increasing feed medium density; and reducing inlet head.
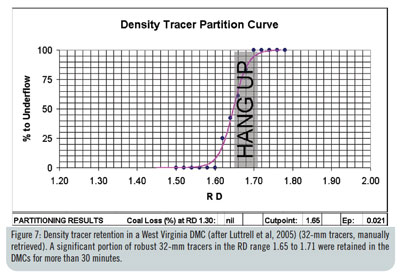
Figure 5 presents results of an audit conducted at a West Virginia plant in 2001 (Luttrell et al, 2005).
 ADVANTAGES & SHORTCOMINGS
The objective of a DMS is to partition particles by density. To determine the efficiency of separators, and whether parallel units are partitioning at the same cut-point, it is wise to use impervious robust particles of precisely known densities (i.e., density tracers). One should not expect conventional sampling and float/sink analyses to provide such accurate results, because those techniques introduce errors, which lead to Ep estimates that can be several times the true values.
Suppose a piece of coal has dried on a stockpile. It encounters water just ahead of a sizing screen, and is partitioned by a DMC a few minutes later. During that period, it progressively absorbs some water — sometimes a considerable amount. Its density at the time of partitioning will depend upon its initial degree of saturation and on its porosity. Those characteristics depend on factors such as coal seam, aquifers, weather, and raw coal stockpiling and handling practice. Samples for float/sink analyses are air dried to a poorly defined degree of saturation. They are then densimetrically separated. Throughout that process, the density of a particle varies depending upon its degree of saturation after air-drying; absorption characteristics of the float/sink liquids, and how they vary with temperature (see Figure 6); the order of progression through the float/sink densities; the duration of immersion at each density; and the degree of draining/drying between each immersion. The densities of coal particles, even of particular individual coal particles, are moving targets.
Other uncertainties should be noted, such as those introduced by sampling errors, particle breakage, imprecise maintenance of float/sink densities, and the wide spacing of float/sink densities (by comparison with achievable Ep values).
The entire procedure generates an apparent partition curve. The estimated cutpoint will probably come within about 0.03 RD of the true value, but an error of 0.03 RD can cause a large yield difference for coking coal partitioned at low cutpoints. The apparent Ep, even for a narrow-size fraction of large particles, will likely be two to three times the true value.
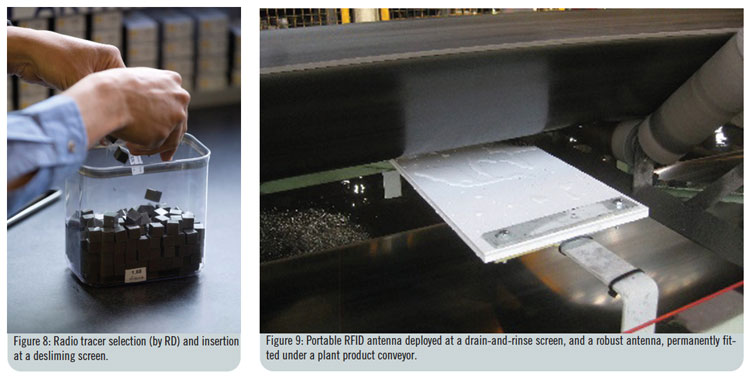
In density tracer audits, it is common to use tracers of a single size and shape; 32-mm cubes for manual retrieval or 13-mm cubes for radio detection. This need not be seen as a drawback of density tracers. Tracers can show if there is middlings retention, which could trigger surging and major loss of yield (Figure 7). Sampling and float/sink analyses will not identify retention, and thus cannot provide the warning that a modest change in coal or medium could suddenly and seriously reduce yield. If, during an audit, the densities of all three medium streams (feed, overflow and underflow) are determined, one may invoke the “pivot point” concept (Scott, 1990, Wood et al, 2014) to estimate the family of partition curves for any nominated size fractions of feed.
 DEVELOPMENT OF RADIO-DETECTED DENSITY TRACER SYSTEMS
As radio-frequency identification (RFID) devices were developed, their potential for tracking of ore and of density tracers was recognized, but it was not until the late 1990s that ground-breaking work was conducted by the CSIR of South Africa. RFID “tags” developed for livestock were inserted into density tracers in the form of weighted plastic balls (de Korte, 2000). A collaborative study by Virginia Tech and Partition Enterprises developed radio density tracers of more precise densities, and demonstrated the concept in-plant (Luttrell et al, 2005). Radio density tracers are designed to be disposable. If they were to be retrieved (as are the earlier style tracer), there would be little point in radio tracking. This calls for low component and production costs, as well as development of detection antennas with sufficient range and high reliability.
Developments in RFID technologies were monitored, and in 2011, further research & development (R&D) was commenced with the objective of bringing this technology to commercial fruition. The first of these systems used 13-mm cubic tracers (see Figure 8) with density intervals as small as 0.01 RD and with tolerance as small as 100% within +/- 0.006 of nominal RD. These were detected using flexible temporary antennas deployed in drain-and-rinse screen launders (see Figure 9a). As tracers passed the various antennas, their IDs, densities, and locations were logged for subsequent downloading and processing to produce the partition curve. Further development included Bluetooth communications so that the developing partition curve could be displayed on a portable computer screen.
A total of 86 such audits were conducted on a commercial basis in 13 Australian plants. In nearly all cases, significant yield losses were identified, with a typical potential yield increase around 2.5% (exceptionally poor results, such as 30% in the case referenced in Figure 4 above, raised the average to 6%). Specific recommendations were presented for correction of the problems. They ranged from immediate re-calibration of Marcy gauges or of nucleonic density gauges, to changes of spigot diameter, magnetite grade or operating pressure, or tightening control of feed medium density. Large DMCs were demonstrated to be capable of excellent partitioning, but this may not hold if manufacturers have substantially increased the ratios of vortex finder diameter to cyclone diameter, or of equivalent inlet diameter to cyclone diameter, in a quest for higher capacity.
In cases where post-modification audits were conducted, the observed values of Ep were close to those predicted when the recommendations were made (Wood et al, 2014).
The next major technical development was that of robust antennas capable of detecting 13-mm radio tracers in coal or stone on conveyors (Figure 9b). If detectors are permanently installed on plant product and rejects conveyors (and on a second product conveyor, if present) they can be used to audit the performance of any coarse coal separator module in the plant, at any time. With radio data telemetry, from a base station in a control room or office, an engineer or operator can activate the detectors, then take selected tracers to the plant and drop them into module feed over any desired period. As tracers are detected, the developing partition curve is updated on the base station screen, and by the time the operator returns from the plant, the accurate curve will be complete. Operating conditions and other parameters may be added before performance analysis, corrective actions (Wood, 2013) and archiving. An automatic tracer dispenser is being developed to cater for long-duration partitioning audits, or for use of the system to track ore through stockpiles for improved control of trainload quality. Patents are pending.
 DMS OPTIMIZATION AND KPIS
As noted above, the use of density tracers at small density intervals, and in sufficient numbers, allows unambiguous determinations of the efficiencies of density separators. Using 13-mm radio density tracers in DMCs, Ep75/25 values as small as 0.004 RD have been recorded, and it is believed that coal-washing DMCs of suitable design are generally capable of 0.008 RD or better, whether operating at low or high cutpoints and with high or low proportions of “near-gravity” material. It should be remembered that the conventionally derived Ep estimate, for a feed, which covers a broad size range, may be around three times that level.
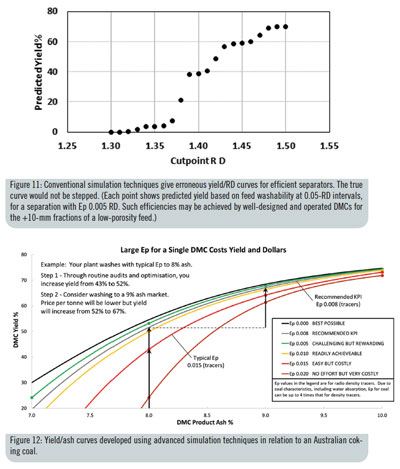
Conventional simulation procedures are inadequate. DMC optimization relies on minimizing Ep values and equalizing cutpoints for separators, which operate in parallel. Prediction of yield and of yield improvements relies on simulation, but conventional simulation procedures are seriously inadequate if Ep values are small. Apart from the shortcomings of float/sink analyses, consider a situation where feed washability has been determined using float/sink intervals of 0.05 RD, including 1.35 and 1.40. Conven-tional simulation implicitly assumes that all of the mass in that fraction (and its quality parameters) are concentrated at the midpoint, 1.375. If the simulation relates to a separator, which achieves Ep 0.005, the simulated yield curve is clearly misleading (Figure 11).
An improved simulation has been developed that sets a KPI Target for Ep. The yield/ash curves of Figure 12 are based on plant feed for an Australian coking coal, and were developed using advanced simulation procedures (Wood, Wood and Hicks, 2014). They show the yield improvement to be realized through optimization of DMC performance, and provide a sound basis for setting an Ep value as a key performance indicator. Similar analyses for thermal coals and higher cutpoints usually show yield increases, which are smaller, but still indicate an outstanding return on investment. Equivalent studies show the value of ensuring that parallel separators partition at equal cutpoints. A cutpoint span of no more than 0.015 RD is suggested as another KPI target.
Since the early 1980s, density tracers have allowed rapid, precise and inexpensive determinations of partition curves for dense medium separators. Magnetic retrieval facilitated reductions in personnel requirements, and techniques for radio detection and identification of tracers allow an audit to be conducted by one person in as little as 30 minutes. Developments in DMC performance modeling and simulation can now utilize those data to determine very specific recommendations for partitioning (and yield) improvement in individual plants.
This article was adapted from a presentation the authors, who represented Partition Enterprises Pty Ltd., delivered at Coal Prep 2015, which was held in Lexington, Kentucky, during April. For more information on this technology, readers are encouraged to visit www.partitionenterprises.com.au. For more information related to Coal Prep 2016, which will be held in Louisville, Kentucky, readers are encouraged to visit www.coalprepshow.com.
REFERENCES
Anon., 1985, “The Heavy Medium Cyclone Washery for Minerals and Coal,” Stamicarbon B.V., (unpublished).
Davis, J.J.; Wood, C.J.; and Lyman, G.J., 1985, “The Use of Density Tracers for the Determination of Dense Medium Cyclone Partitioning Characteristics,” Inter-national Journal of Coal Processing, 2(2) pp 107-126.
de Korte, J., 2000, “An overview of dense-medium plant efficiency testing with the emphasis on rapid efficiency testing with the aid of radio tracers,” South African Institute of Mining and Metallurgy 12th Int. Conf. on Coal Research.
Napier-Munn, T.J., 1985, “The Use of Density Tracers for the Determination of the Tromp Curve for Gravity Concentration Processes.” Trans. Inst. Min. Met., 94, C47-C53.
Luttrell, G.H., Barbee, C.J., Bethell, P.J. and Wood, C.J., 2005, “Dense Medium Cyclone Optimisation,” Final Technical Report to the USA Department of Energy under Award Number DE-FC26-01NT41061.
Scott, I.A., 1990, “A Dense Medium Cyclone Model Based on the Pivot Phenomenon,” : Ph.D. thesis (unpublished), University of Queensland.
Wood, C.J., 1990, “A Performance Model for Coal-Washing Dense Medium Cyclones,” : Ph.D. thesis (unpublished), University of Queensland.
Wood, C.J., 2013, “Coal Washing Dense Medium Cyclones,” in Mathewson D. and Ryan G. (Eds), ACARP Dense Medium Cyclone Handbook, Australian Coal Preparation Society.
Wood, C.J., Wood, R.F. and Hicks, M.W.,2014, “Radio-Detectable Density Tracers: Experience to Date,” in Sherritt, G. (Ed), Proceedings of the 15th Australian Coal Preparation Conference, Paper 2A.