
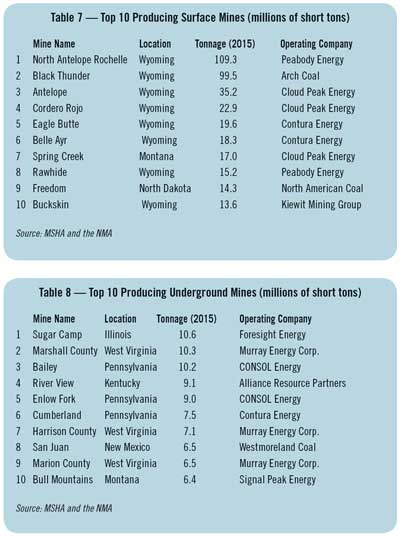
Large PRB mines, like the Belle Ayr mine (above), are capable of mining near half of the total U.S. output in 2016.
The fact that the coal industry has been under siege for the last four years has been well documented. With the President Barack Obama administration pursuing a climate change agenda that likely has no merit, the scale has been tipped in favor of natural gas and away from coal, the baseload fuel that provided most of the power for America’s growth during the 20th century. The U.S. natural gas industry has discovered and tapped huge reserves, bringing more of a competitive fuel to market, while keeping costs low.
Faced with an onslaught of environmental regulations and declining power consumption from a moribund economy, most U.S. power producers selected the path of least resistance. Almost all of the new power capacity was switched to either natural gas or nuclear. Older coal-fired power plants that would have required a significant investment for pollution control systems were replaced with new natural gas plants. In some cases, utilities have switched from existing coal-fired capacity to natural gas to comply with the proposed environmental regulations. Even though some of the regulations have been overturned by the courts as being unfair, the damage these policies have inflicted on the U.S. coal industry cannot be undone.
 This year will be the year the coal business will really feel the pain — more than it has felt in more than 50 years. The warnings began to surface last year as several of the large coal companies filed for Chapter 13 bankruptcy protection to reorganize debt. In hindsight, many of them had over-paid for assets acquired during a merger and acquisition frenzy. When the market began to soften, they could no longer service the debt.
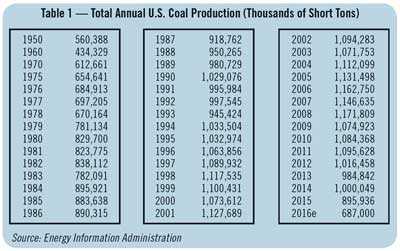
Compared to five years ago, the bottom has fallen out of the coal market. Choose any statistic — demand, employment, prices or production — the figures are staggering. Total U.S. coal production this year will likely be less than 700 million tons, the lowest level since the late 1970s. Granted, 700 million tons is still a significant amount of coal. For an industry that had grown accustomed to 1.1 billion tons per year (tpy), however, it’s a more than 36% drop in five years.
Just like the world that surrounds it, the difference between the coal business today and the late 1970s has also changed significantly. Today, 20 large western surface mines in the Powder River Basin (PRB) are capable of producing 375 million tpy. Construction was just beginning on those mines in the late 1970s. Likewise, the 100 or so longwall mines that were commissioned in the 1980s have been replaced by 50 more efficient longwalls that produce twice or three times as much coal. Together, those longwalls account for roughly 200 million tpy of production capacity. That leaves roughly 125 million tpy in production capacity to be filled by the remaining 300 mines capable of producing 100,000 tpy or more.
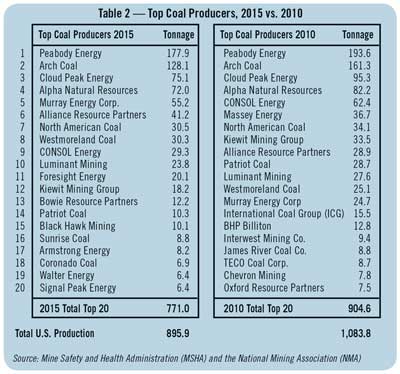 Major U.S. Coal Operators
While the landscape among the top 20 U.S. coal producers has changed substantially during the past five years, there are a few noticeable constants. As a group, they represented 86.1% of total U.S. production. In 2010, they accounted for 83.5% of production. The top four coal operators remained the same and the order by production remained the same, although the amount of production dropped substantially. The leading coal producer, Peabody Energy, produced 15.7 million tons less in 2015 than it did in 2010; similarly, Arch Coal gave up 33.2 million tons; Cloud Peak Energy mined 20.2 million less tons; and Alpha Natural Resources’ figures dropped by 10.2 million tons. What makes these figures even more remarkable is that Arch Coal purchased International Coal Group and Alpha merged with Massey Energy, which represented an additional 15.5 million tons and 36.7 million tons, respectively. Several other names disappeared from the U.S. coal scene as well: BHP Billiton, James River Coal, TECO Coal and Chevron Mining.
 The mergers, acquisitions and bankruptcy reorganizations have allowed other coal producers to ascend and created room for others to appear on the top 20 list. Murray Energy Corp. acquired a number of longwall operations from CONSOL Energy. The two companies essentially traded places in the rankings. Westmoreland Coal acquired a few coal operations and climbed up the rankings. The new names that have appeared since 2010 include Foresight Energy, Bowie Resource Partners, Black Hawk Mining, Sunrise Coal, Armstrong Energy, Walter Energy and Signal Peak Energy. Foresight Energy constructed a number of Illinois Basin (ILB) longwall mines. Bowie Resources purchased several western longwall operations. Black Hawk bought the James Rivers properties. Coronado has steadily built a portfolio of properties through acquisition.
Among this top 20 group, there is also a core of three coal operators that consistently go about their business, despite the flurry of activity around them. Together, Alliance Resource Partners, North American Coal and Luminant Mining represent 95.5 million tpy of coal production, which is up from 90.5 million tons five years ago. While production at both North American and Luminant has dropped by a little less than 4 million tons, Alliance has grown its production by more than 13 million tons.
Looking toward the future, the list will continue to evolve. It’s already clear that overall production in 2016 will be lower than 2015. Next year, Murray Energy could move into the No. 4 position displacing Alpha Natural Resources, the bulk of which will now be known as Contura Energy, which is expected to produce 50 million tons. The new Alpha Natural Resources will drop into the mid-teens on the top 20 list. ERP Compliant Fuels acquired several Patriot properties and longwall operations from Cliffs Natural Resources, which should place them among the midpoint of the top 20 U.S. coal producers.
Regional Shifts in Coal Employment
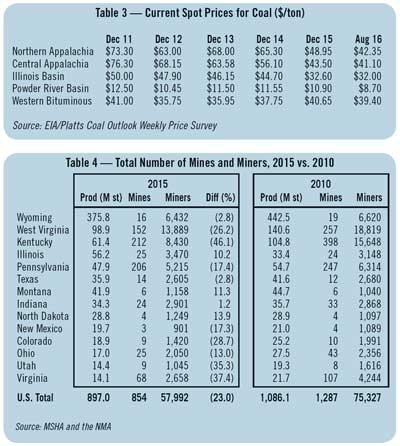
Comparing the number of mines and employment figures from 2015 to 2010 reveals the market shifts that have taken place. The number of coal mining operations have declined from 1,287 in 2010 to 854 at the end of 2015. Overall employment in the coal industry has declined by 23% to 57,992 miners from 75,327 miners in 2010.
The mines in the eastern U.S. have suffered the most job losses. Employment in Kentucky and West Virginia dropped by 7,218 (46.1%) and 4,930 (26.2%), respectively. West Virginia saw more than 100 mines close in five years. In Kentucky, the number of mines dropped by about one-half from nearly 400 in 2010 to a little more than 200 in 2015.
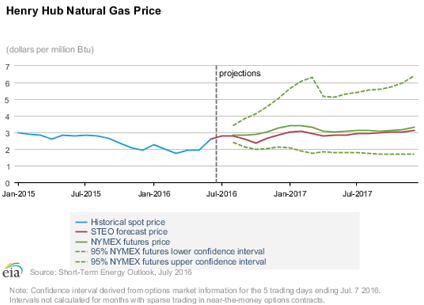
Figure 1: Natural gas projections.
With a number of new longwall mining operations being commissioned, coal production and employment grew in Illinois during the last five years. Production in Indiana has remained about the same, and employment grew slightly. If the ILB, which includes Illinois, Indiana and western Kentucky, has stabilized or showed signs of improvement during the past five years, then eastern Kentucky, an area that desperately needs jobs, has felt the full force of the market downturn.
In the American West, the impact during the last five years has been a mixed bag. Subbituminous coal production in Wyoming and Montana has slowed. Production in Wyoming actually dropped more than 66 million tons, or 15%, while employment only dropped 2.8%, which speaks volumes about the economies of scale with those operations. The lignite mining operations in North Dakota remained about the same, four mines producing about 29 million tons, but employment grew. Production in Montana declined by 2.8 million tons and employment grew, reflecting the commissioning of a new underground production facility (Signal Peak), which would require more manpower.
The western bituminous mines in Colorado and Utah suffered declines on a similar percentage level as the eastern U.S. mines, albeit on a much smaller scale: 28.7% and 35.3%, respectively. Operating 10 mines or less throughout the period, they have lost more than 1,142 coal mining jobs.
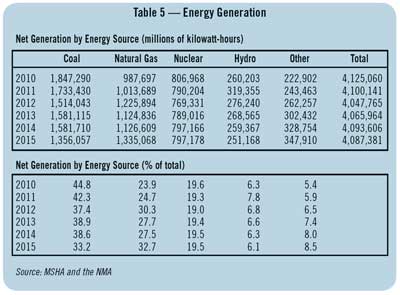 Trends in Power Generation
Roughly 90% of the coal mined in the U.S. is burned for electrical power generation. The Energy Information Administration (EIA) recently reported that coal-fired generating capacity in the United States has fallen 15% over the past six years, dropping from 317 gigawatts (GW) at the end of 2010 to 276 GW in April. The EIA attributes the change to the competitive pressure from low natural gas prices, which lowers the marginal cost of natural gas-fired generation, and the costs and technical challenges of environmental compliance.
The EIA also tracks data on pollution control equipment at electric power plants and it can assess the investments in these technologies. For example, a significant amount of pollution control equipment was recently installed in response to the Environmental Protection Agency’s Mercury and Air Toxics Standards (MATS). MATS establishes emissions limits for mercury, arsenic and heavy metals. Between January 2015 and April 2016, about 87 GW of coal-fired power plants installed pollution control equipment, nearly 20 GW of coal capacity retired, and about 5.6 GW of overall coal capacity switched to natural gas.
Of the 87 GW of coal capacity that installed pollution control equipment to comply with MATS, activated carbon injection (ACI) was the dominant compliance strategy. More than 73 GW of coal-fired capacity installed ACI systems in 2015 and 2016, effectively doubling the amount of coal capacity with ACI. According to EIA data, the average capital cost of an ACI system was $5.8 million over 2015 and 2016.
The EIA also tracks modifications of existing emissions control equipment, the addition of new equipment or capabilities, or some combination of operational changes and new investments to improve mercury capture or to achieve other environmental control objectives, such as reducing emissions of particulate matter or nitrogen oxide. Overall, EIA’s data indicate that operators of coal-fired power plants invested at least $6.1 billion between 2015 and April 2016 to comply with MATS or other environmental regulations.
 Natural Gas Supply and Price Projections
According to the EIA’s 2016 Short-term Energy Outlook, working inventories of natural gas were 3,179 billion cubic feet (Bcf) on July 1. This level is 20% higher than a year earlier, and 23% higher than the previous five-year (2011-15) average for that week. The natural gas storage injection season typically runs from April through October. EIA projects that natural gas inventories will be 4,022 Bcf at the end of October 2016, which would be the highest end-of-October level on record. Henry Hub spot prices are forecast to average $2.36/million British thermal units (MMBtu) in 2016 and $2.95/MMBtu in 2017, compared with an average of $2.63/MMBtu in 2015.
Natural gas future contracts for October 2016 delivery that were traded during the five-day period ending July 7 averaged $2.88/MMBtu, according to the EIA. Current options and futures prices imply that market participants place the lower and upper bounds for the 95% confidence interval for October 2016 contracts at $2/MMBtu and $4.14/MMBtu, respectively. In early July 2015, the natural gas futures contract for October 2015 delivery averaged $2.85/MMBtu, and the corresponding lower and upper limits of the 95% confidence interval were $1.92/MMBtu and $4.24/MMBtu.
Meanwhile, spot prices for coal are at their lowest levels, and the fuel can’t compete. Today, the spot price for Northern Appalachian (NAPP) coal stands at $42.35/ton, a 42.2% decrease from five years ago ($73.30/ton). Similarly, Central Appalachian coals are selling for $41.10/ton, an even greater 46.1% decrease from five years ago ($76.30/ton). ILB and PRB spot prices are down 36% and 30.4%, respectively, over the last five years.
For the remaining U.S. coal operators, who face declining market demand, what’s left of the profit margin is being squeezed by record low prices. They will see no relief unless total power generation grows, which could happen if the economy improves substantially, and/or excess capacity is removed from the market. Removing excess capacity equates to more gas being burned or a further idling of coal production capacity. This year has been and will continue to be a difficult year for U.S. coal operators.