The method of engineering design is the process of choosing the appropriate components to make a functional structure that is sufficiently safe. Engineering design typically involves an iterative, purely deterministic approach where a multitude of inputs are adjusted until the optimal design is reached. This deterministic approach to assess safety and durability generally results in a factor of safety (FS) value, as calculated by:
The factor of safety is a very easy calculation to perform in many circumstances, and it is very easy to interpret the results. If the strength of a component or a structure is greater than the stress expected to be applied to the component or structure, then the factor of safety will be greater than one and the component or structure is not expected to fail. However, if the stress exerted on the component or structure exceeds the strength, then the factor of safety will be less than one and the component or structure is expected to fail.
For the deterministic approach to be used, it must be assumed that the exact inputs are known. If the exact inputs are known, then the exact solution can be determined. The deterministic approach is a very simple approach to engineering design. The greatest strength of a deterministic factor of safety calculation is also its greatest weakness: it is extremely simple. Because of its simplicity, the deterministic approach to factor of safety calculations is completely lacking in uncertainty quantification.
Uncertainty quantification is an important practice in all engineering practices. This is especially true when regarding geotechnical engineering. A high level of uncertainty is involved with engineering geotechnical structures. A common method of skirting the issue of uncertainty quantification is to take a conservative approach to design. The conservative approach involves underestimation of the strengths and/or overestimation of the stresses in an attempt to guarantee a safe design. Using a conservative approach for engineering design does not guarantee safety, can lead to overdesign of components and structures, and removes meaning from the term factor of safety by introducing intentionally arbitrary inputs.
This conservative approach has led to design standards that require factors of safety for elevators to be as high as 11. Elevators must be overdesigned to some degree because of the likelihood of misuse and the dire consequences of failure, but many engineering structures do not require the overdesign that is typically present. Intentionally designing to a factor of safety much greater than 1 indirectly admits the fault in the deterministic approach while bypassing more meaningful and less arbitrary alternatives.
Probabilistic Approach
A probabilistic approach to engineering design can be a superior alternative to a deterministic approach. Instead of considering one value for each input in an engineering design calculation, a probabilistic approach allows for a distribution of values for each input parameter. A distribution is used rather than a single value to represent the uncertainty or variability in the data. With a distribution of inputs, the output will also take the form of a distribution. This distribution of outputs leads to the greatest strength of the probabilistic analysis, which is a meaningful result.
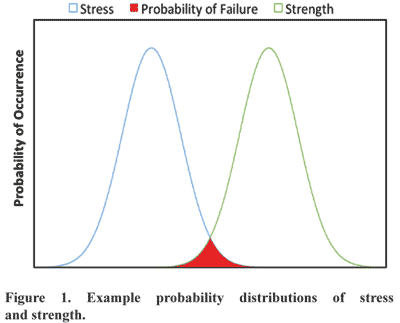
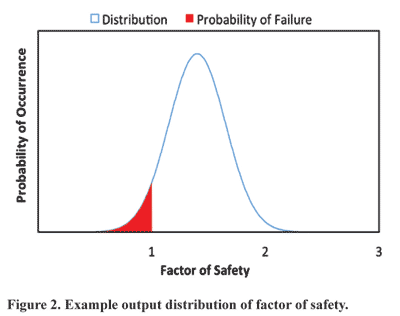
Using a probabilistic approach for calculating factors of safety can easily be visualized in a few different ways. Figure 1 shows possible distributions of stress and strength for an example probabilistic analysis. The probability of failure in the example component or structure is the area confined in the overlap where the stress exceeds the strength. Figure 2 shows a second possible visualization of results from a probabilistic analysis. With the factor of safety output plotted as a single distribution, the probability of failure is simply the area under the curve to the left of a factor of safety equal to one. This is a simplified version of possible results from stochastic analyses, but a more complex analysis will likely take the same general form.
The probabilistic approach has some inherent advantages over the more widely used deterministic approach. Two of these advantages are:
- Input parameters represented by single values suggest knowledge of the exact value. Input parameters represented by distributions show uncertainty or variability in the data, which makes them a more realistic representation.
- Probability of failure is more meaningful than safety factor in many instances. Designing to an acceptable probability of failure is a better engineering practice than setting an arbitrary factor of safety threshold.
These are two of the more important advantages of the probabilistic method over the deterministic method, but there are additional, less obvious advantages. There is a smaller chance of user error when a probabilistic analysis is used. This is inherent to the method, because the user is not forced to determine a single value for the input parameters. Fundamentally accounting for any uncertainty in the calculation allows the user to be more certain of inputs. Furthermore, the process can be quicker and easier to implement. After performing a deterministic design calculation, a sensitivity analysis it typically required to deal with uncertainty. A probabilistic analysis removes the need for a sensitivity analysis because the uncertainty is handled inherently.
Probabilistic analyses for engineering design have been used in many industries to determine probability of failure. The natural variability of the ground makes geotechnical design a unique setting where a probabilistic approach should be used more widely. A transition toward using the probabilistic approach for engineering design of geologic structures is taking place for rock wedge failure (Park and West, 2000), slope stability, and room-and-pillar failure in oil shale mining and underground uranium mines, among others. This transition to using a probabilistic approach for geotechnical engineering design has been slow, controversial, and mostly neglected by the room-and-pillar coal mining industry.
Coal Pillar Design
Like many other structural design problems, coal pillar design can be expressed as a factor of safety. Estimating stress on a coal pillar can be relatively straightforward, but the method for determining coal pillar strength is not as well established. There are many equations for coal pillar strength, and any of them can be appropriate in a given set of conditions.
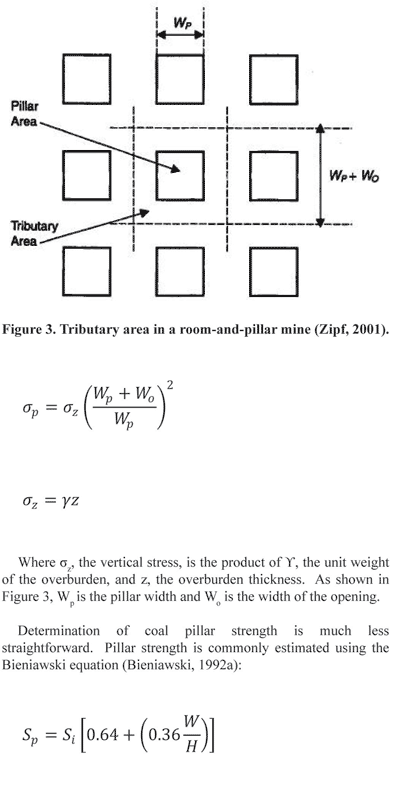
The stress supported by a pillar in a room-and-pillar mine can be assumed to be a function of the tributary area and the pillar area, shown in Figure 3, as well as the overburden stress. It is assumed that each pillar supports the volume of overburden in the column above the tributary area of that pillar. For square pillars with a consistent, rectangular pattern, the equation for pillar stress, σp, becomes
Where σz, the vertical stress, is the product of ϒ, the unit weight of the overburden, and z, the overburden thickness. As shown in Figure 3, Wp is the pillar width and Wo is the width of the opening. Determination of coal pillar strength is much less straightforward. Pillar strength is commonly estimated using the Bieniawski equation:
Where Si is the compressive strength of coal, and W/H is the coal pillar width to height ratio. Like most equations for coal pillar strength, the Bieniawski equation is empirical. This equation was chosen because its ubiquitous use for calculating the stress of square coal pillars.
The Analysis of Retreat Mining Pillar Stability (ARMPS) program created by the National Institute for Occupational Safety and Health (NIOSH) is often used in addition to or instead of a factor of safety calculation. The ARMPS program reports a “stability factor,” which is similar to a deterministic safety factor. The stability factor is the ratio of the load bearing capacity of the pillars within the active mining zone (strength) to the total load applied to the pillars within the active mining zone (stress). The active mining zone is defined to include all of the pillars within five times the square root of the depth of cover of the excavation front. Designing with a stability factor of at least 1.5 is recommended when the depth of cover is greater than 1,000 ft.
Probabilistic Coal Pillar Study
Two mine geometries were assumed to test the probabilistic procedure involved with underground coal pillar design. Both geometries were six-entry panels with 20-ft entries. One scenario had 40- x 40-ft pillars, the other had 60- x 60-ft pillars. The results for these designs were calculated for multiple depths. A mean value was assigned to each required input parameter, and a reasonable standard deviation for each value was estimated.
Each input parameter was assumed to be normally distributed. Except for the pillar dimensions and the depth of cover, the distribution of all parameters remained the same for both scenarios. The compressive strength of coal is notoriously difficult to test in a laboratory. Coal samples degrade quickly once removed from confinement, and coal exhibits a rather extreme size effect. The in situ strength of coal is generally accepted to be 900 psi, but this value has been known to vary. In situ coal strength has been determined to fall between 780 and 1,070 psi. Therefore, the mean value for in situ coal strength was assumed to be 900 psi with a standard deviation of 72.5 psi. This range results in the typical range of in situ coal strength reported by Mark and Barton to be approximately ±2 standard deviations.
The room-and-pillar layout was assumed to consist of 40-ft square pillars on 60-ft centers for the first scenario and 60-ft square pillars on 80-ft centers for the second scenario. Both of these geometries result in an entry and crosscut width of 20 ft. The pillar width was given these mean values with a standard deviation of 0.5 ft. The entry width was assumed to be the center-to-center spacing minus the pillar width to keep the mine geometry consistent. The mining height was given an arbitrary mean of 6 ft and standard deviation of 0.25 ft.
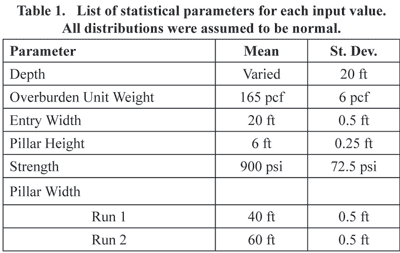
All of the input parameters required for this simple study are listed in Table 1. The only parameter changed between the first and second runs is the pillar size. Depth was varied to compare the probabilities of failure from the probabilistic study to the stability factors from ARMPS. The stability factors were calculated for the mine geometries under development loading only.
Monte Carlo simulations were performed for each of the two runs to determine distributions for the likely factors of safety resulting from these synthetic data sets with the stress and strength equations discussed above. Random numbers were generated by MATLAB for each of the input parameters, with the exception of entry width, which is a function of pillar width, and the factor of safety was determined. Each Monte Carlo simulation consisted of 1 million iterations for each of the two runs.
Results
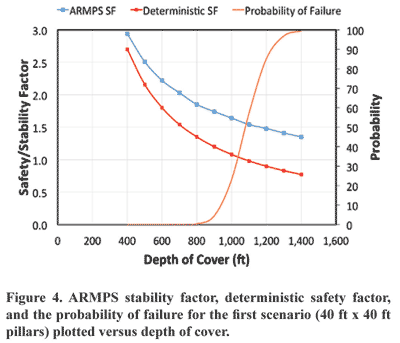
The results from the Monte Carlo simulations were compared to the stability factors calculated by ARMPS and the deterministic safety factors for a variety of depths. The deterministic factor of safety results were found by inputting only the distribution means into the stress and strength equations. For the first scenario, the depth of cover was varied from 400 ft to 1,400 ft. The depth of cover was varied from 400 ft to 2,400 ft for the second scenario. Plotted in Figure 4 are the probability of failure from the stochastic analysis, the safety factor from the deterministic analysis, and the stability factor from ARMPS for varying depths of cover for 40 ft x 40 ft pillars. There is relatively good agreement between all three pillar design methods. The minimum stability factor recommended for a “satisfactory” pillar system is 1.5 for depths of cover greater than 1,000 ft. The depth of cover corresponding to a stability factor of 1.5 is approximately 1,100 ft. At this same depth, the safety factor resulting from the deterministic method is approximately 1.
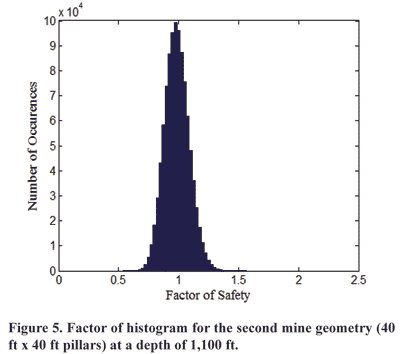
The probability of failure at 1,100 ft is approximately 0.6, which means 60% of pillars subjected to this loading scheme are expected to fail. This probability of failure is more conservative than the other results. The distribution of safety factors is normally distributed and centered close to one, as shown in Figure 5. The largest safety factor calculated was approximately 1.6 and the smallest value was approximately 0.6. This range is due to the standard deviations assigned to the input parameters.
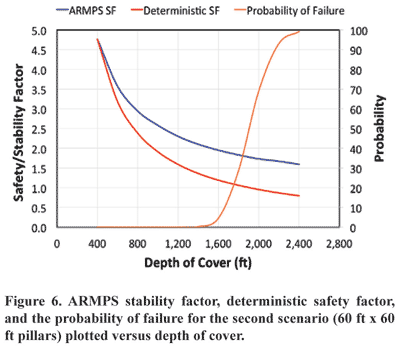
The second Monte Carlo analysis was performed assuming 60-ft x 60-ft pillars. The depths for this geometry were varied from 400 ft to 2,400 ft. The resulting ARMPS stability factors, deterministic safety factors, and probabilities of failure are plotted versus depth in Figure 6.
The synthetic study resulted in more conservative values than ARMPS for the second scenario. The ARMPS stability factor approaches 1.5 for a depth of 2,400 ft. At 2,400-ft deep, the deterministic safety factor is approximately 0.8 and the probability of failure is 0.992.
Discussion
The results from the synthetic study and the results from the ARMPS varied somewhat. The difference between the results of the two methods increases with increasing depth of cover. This is most likely because the tributary area method of pillar stress determination was used for the synthetic study. The tributary area method leads to a conservative estimate of the stress on a pillar by as much as 40%.
Before the probabilistic approach to coal pillar design could become widely applied, standards would need to be created. Geotechnical engineering involves too much variation to adhere to the Six Sigma standard. An acceptable probability of failure threshold would have to be decided upon.
For example, if a probability of failure of 30% were deemed an appropriate design threshold, this would correspond to a stability factor of approximately 1.6 for the first scenario and 1.8 for the second scenario. A more realistic approach for estimating coal pillar stress should be used that would result in a more reasonable value that could be consistent with industry-wide standards.
The scope of the probabilistic approach could be increased by performing a similar calculation for an entire panel rather than just one pillar. This could be done with a Gaussian field representing the spatial distribution of coal strengths, entry height, etc. While the Monte Carlo for the simple, single-pillar example has a rather quick computation time, a panel-sized probabilistic method could take a significant amount of time to perform.
Conclusions
Uncertainty quantification is necessary in all engineering practices. This is especially true when regarding geotechnical engineering. Probabilistic analyses for engineering design are becoming more prevalent in many fields where a high degree of uncertainty is present but remain mostly absent in coal pillar design.
Performing a probabilistic study rather than a deterministic one is a relatively easy way to quantify the uncertainty in an engineering design. A sensitivity analysis requires actively varying the inputs a slight degree to determine how the output is affected. This process can be much more time consuming, more user intensive, and less comprehensive than a probabilistic analysis like the one performed here.
A probabilistic approach to coal pillar design has potential to be a viable alternative to traditional deterministic methods. Accounting for variability or uncertainty in the inputs and outputs of engineering design calculations provides more meaningful results. Designing to arbitrary deterministic thresholds indirectly admits the fault in the deterministic approach.
The simple synthetic study performed involved comparing the results of a simple factor of safety determination to the stability factor calculated by ARMPS. Both the probability of failure and a deterministic factor of safety were determined using the Bieniawski equation for coal pillar strength and the tributary area assumption for coal pillar stress.
For 40-ft square pillars in a six-entry panel under development loading, ARMPS resulted in a stability factor of 1.5 at approximately 1,100 ft of cover. This same scenario in the synthetic study resulted in a probability of failure of approximately 60%. The results of the synthetic study agreed somewhat with the output from ARMPS, but were more conservative than ARMPS. The conservative nature of the synthetic study was found to increase with depth.
Ben Fahrman is a graduate student and Erik Westman is an associate professor with Virginia Tech’s Mining & Minerals Engineering Department. They presented this paper at the Ground Control Conference, which took place in Morgantown, W.Va., during August 2013.


